MonitorMyMoon.com was covered on Canadian Broadcasting Corporation (CBC) National during the live Artemis II splashdown coverage
CBC What this student has seen tracking the Artemis II mission herself Watch → CBC A Toronto Grade 11 student tracking the Artemis mission Listen →
M...N
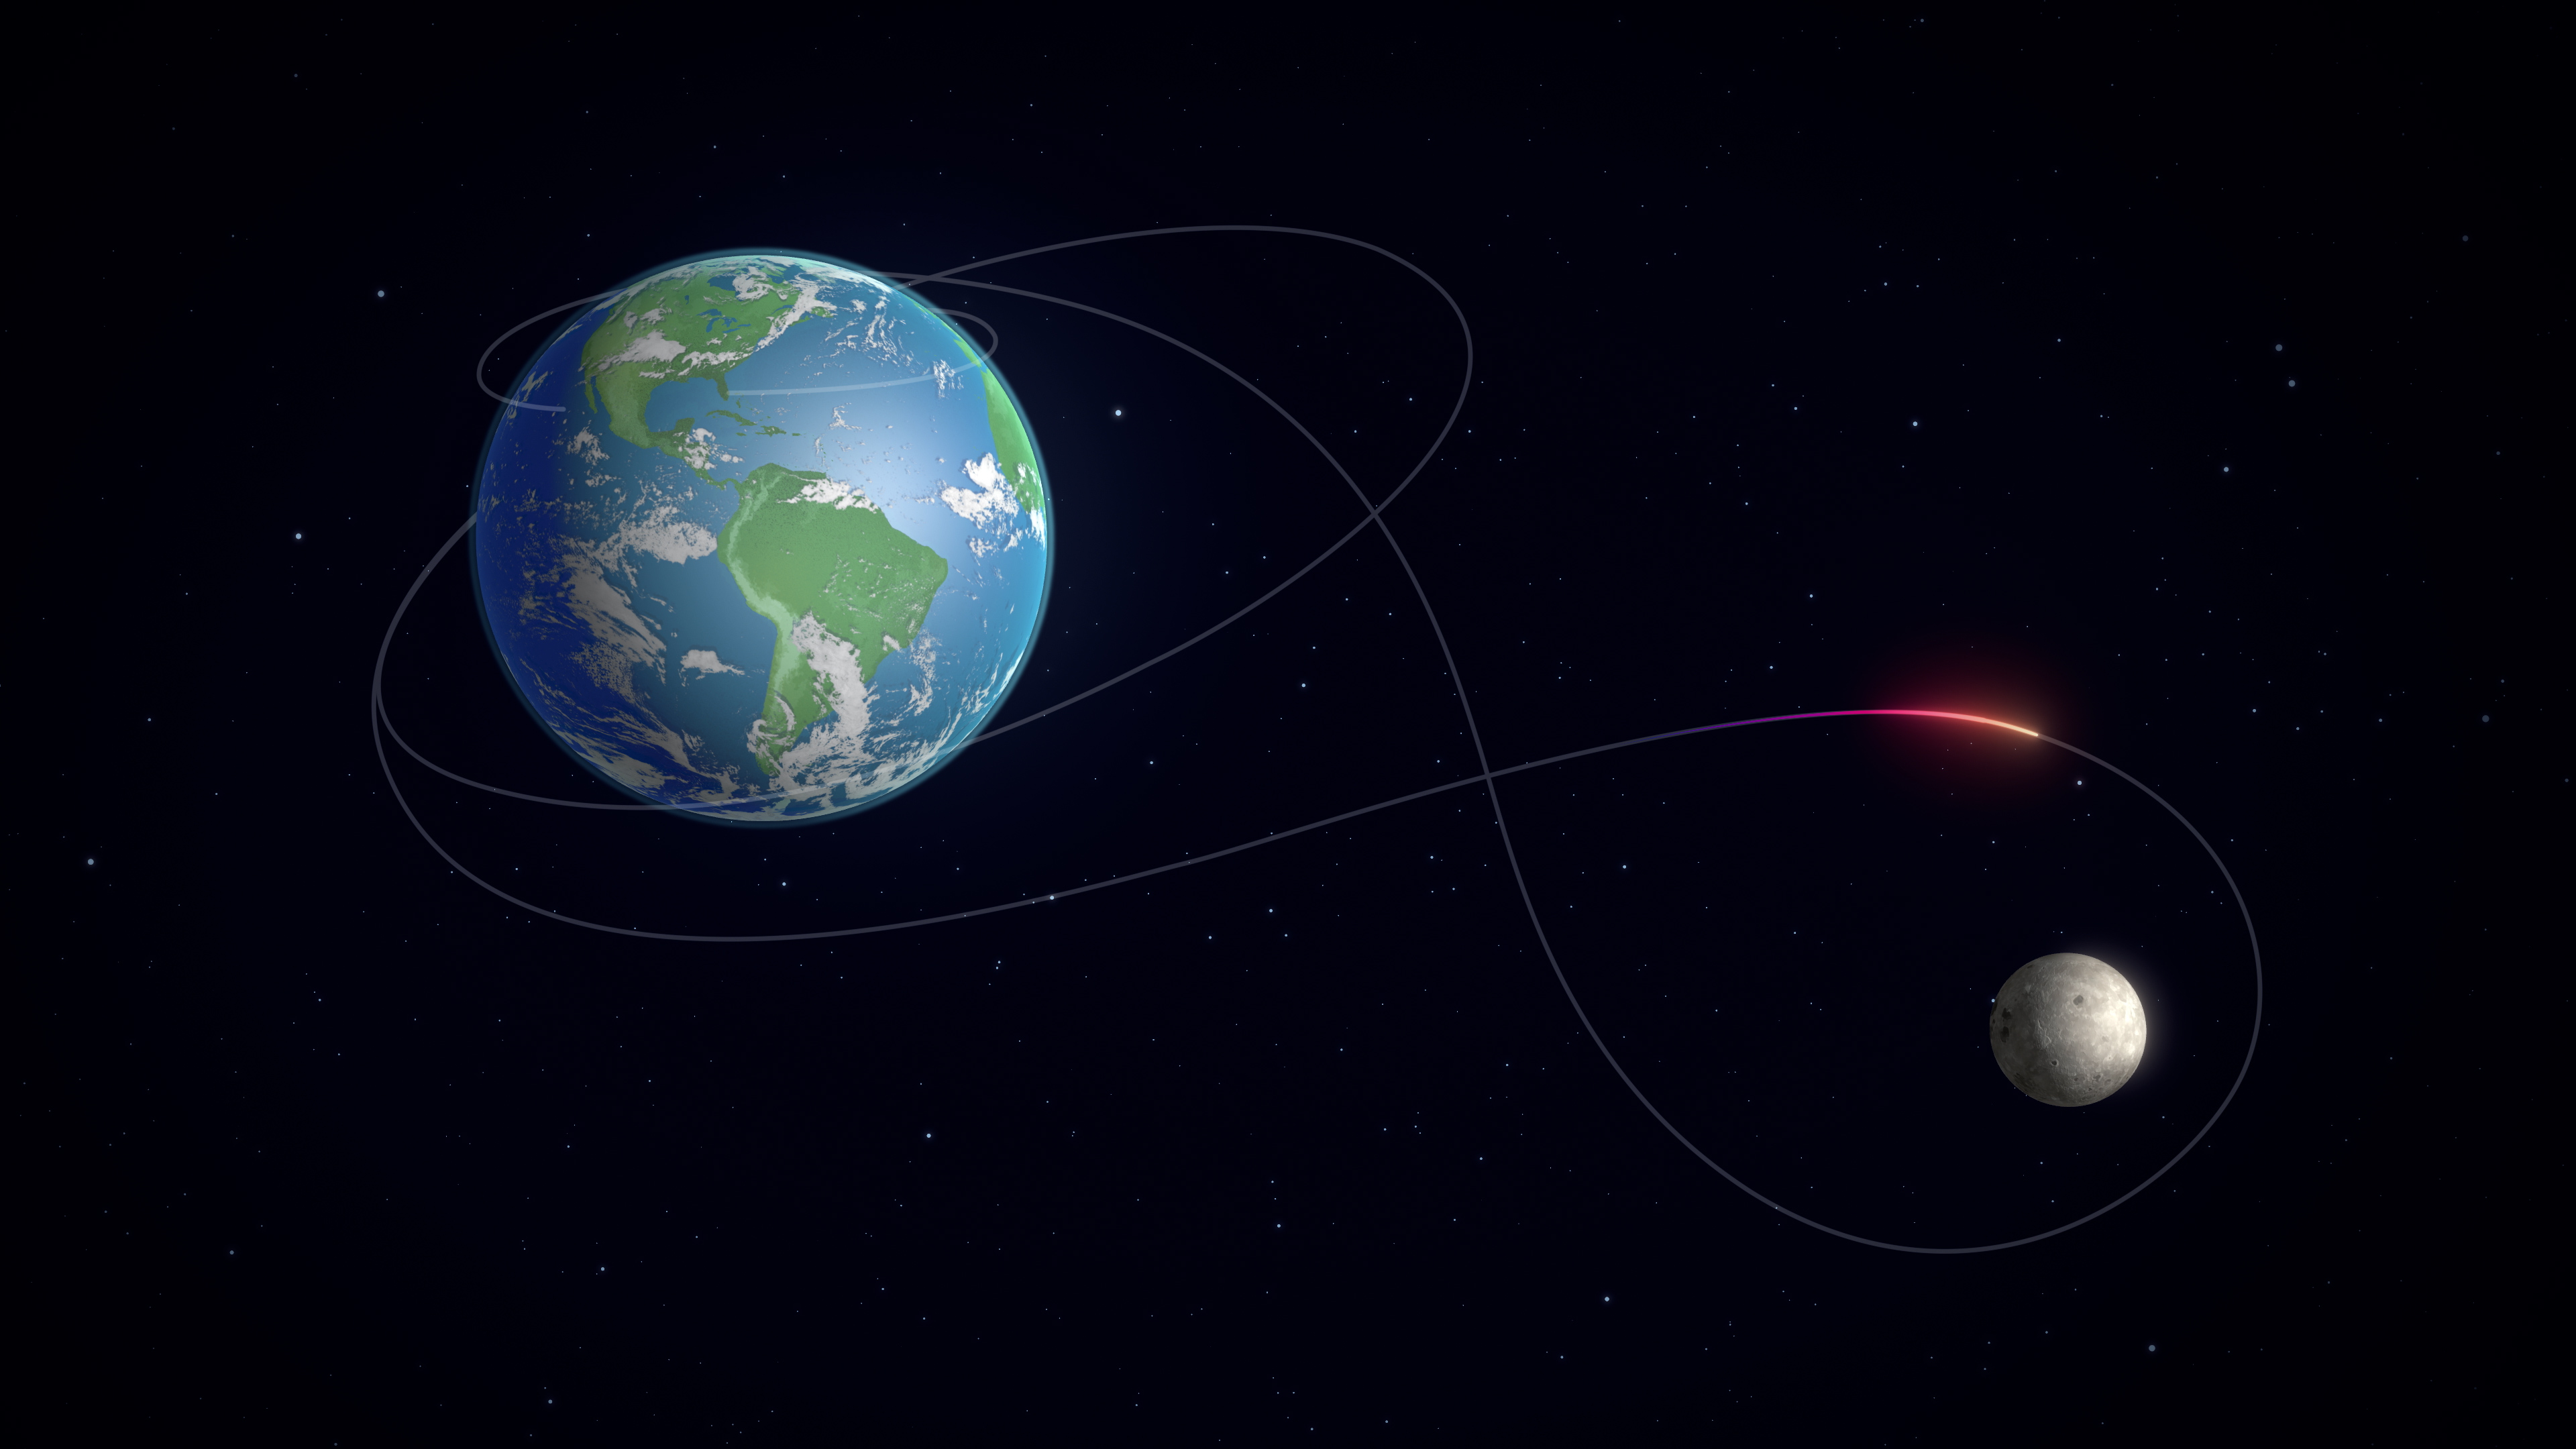
Monitoring Orion through Open-data Networks
Tracking Artemis II to the Moon and Back
From Open Data

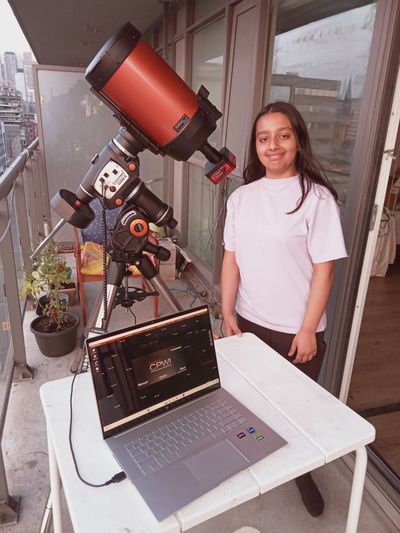
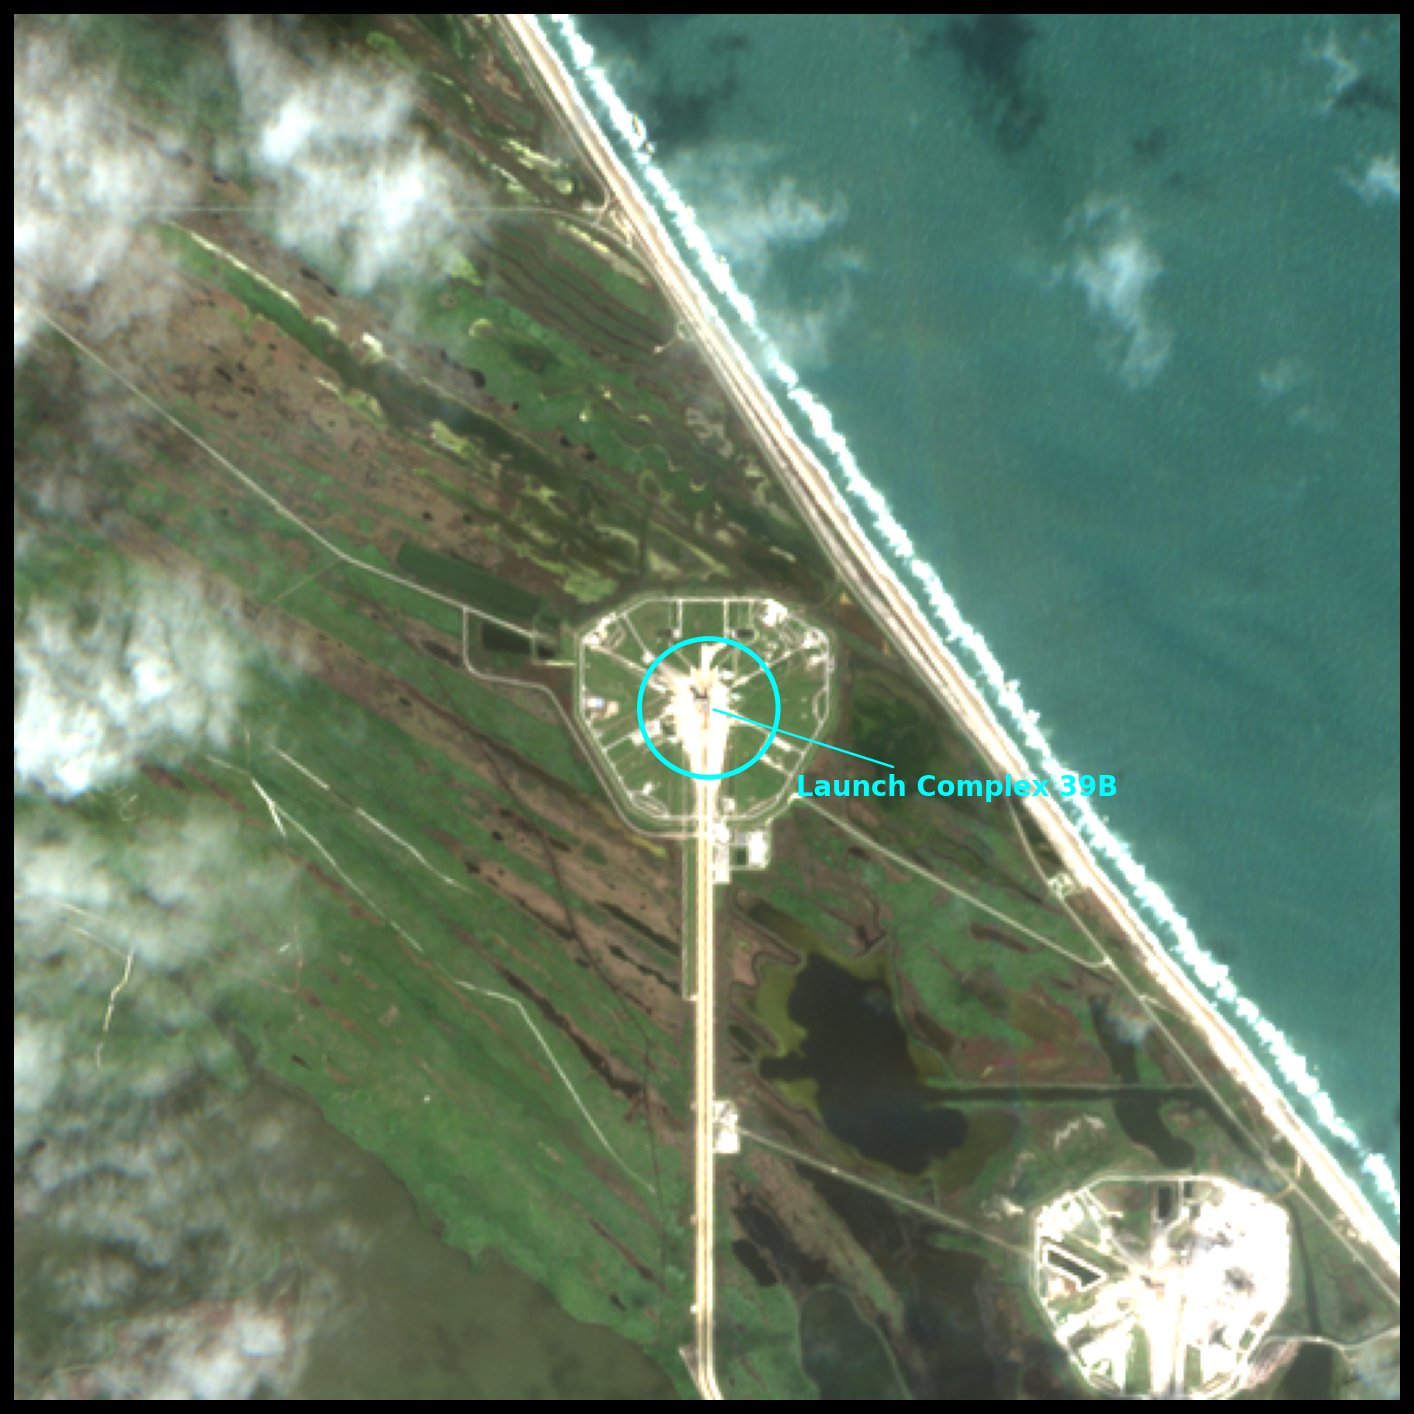
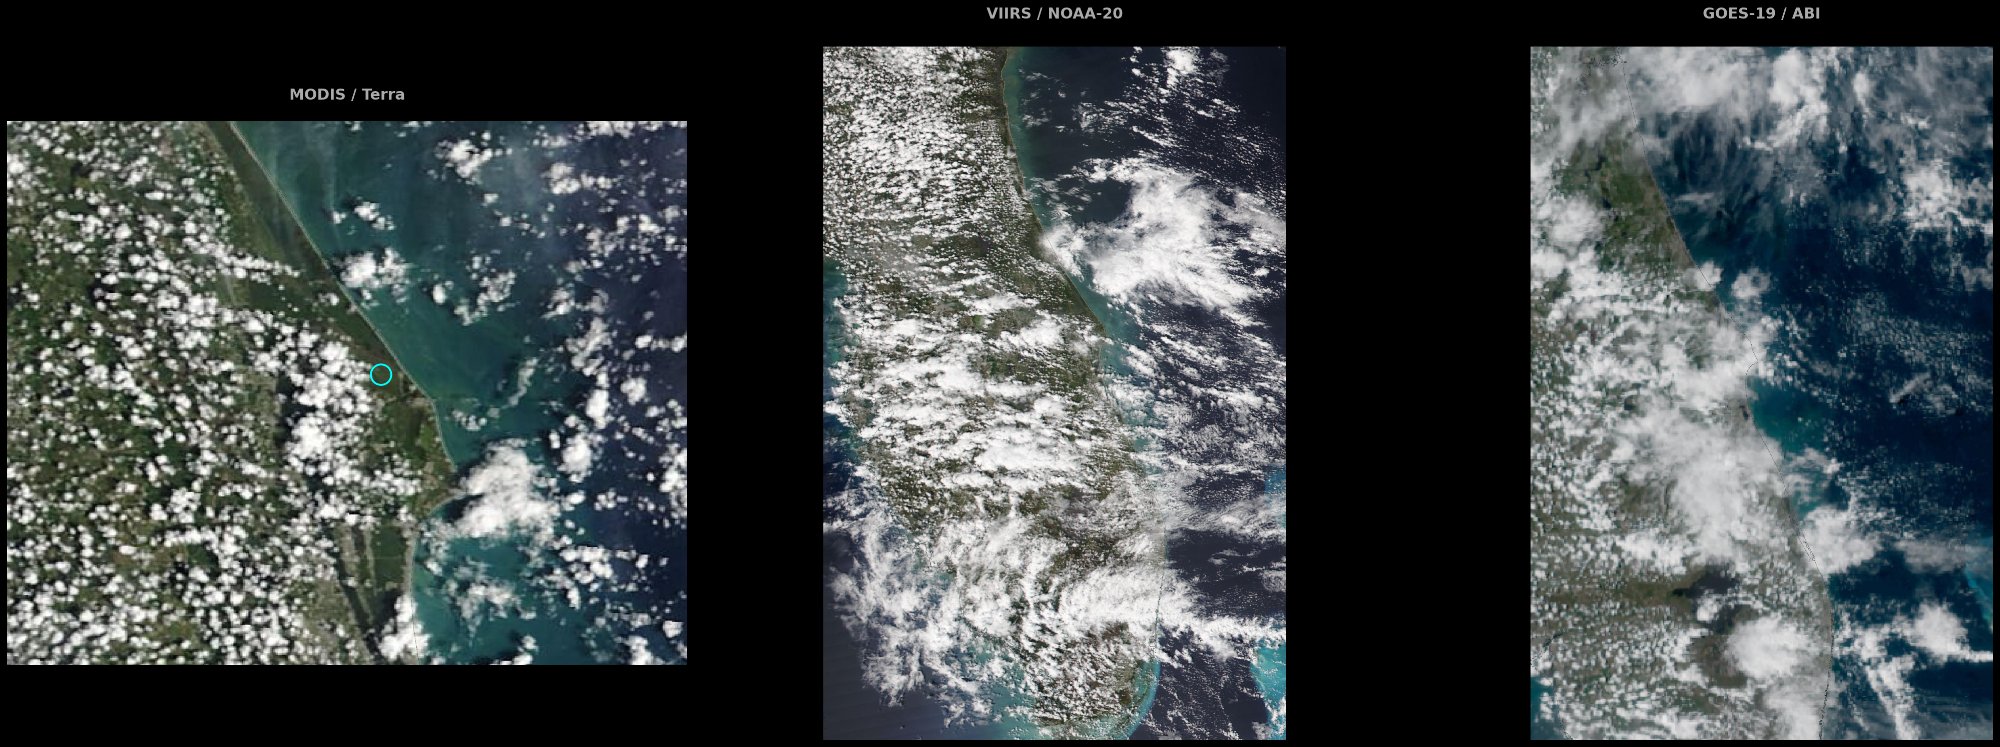
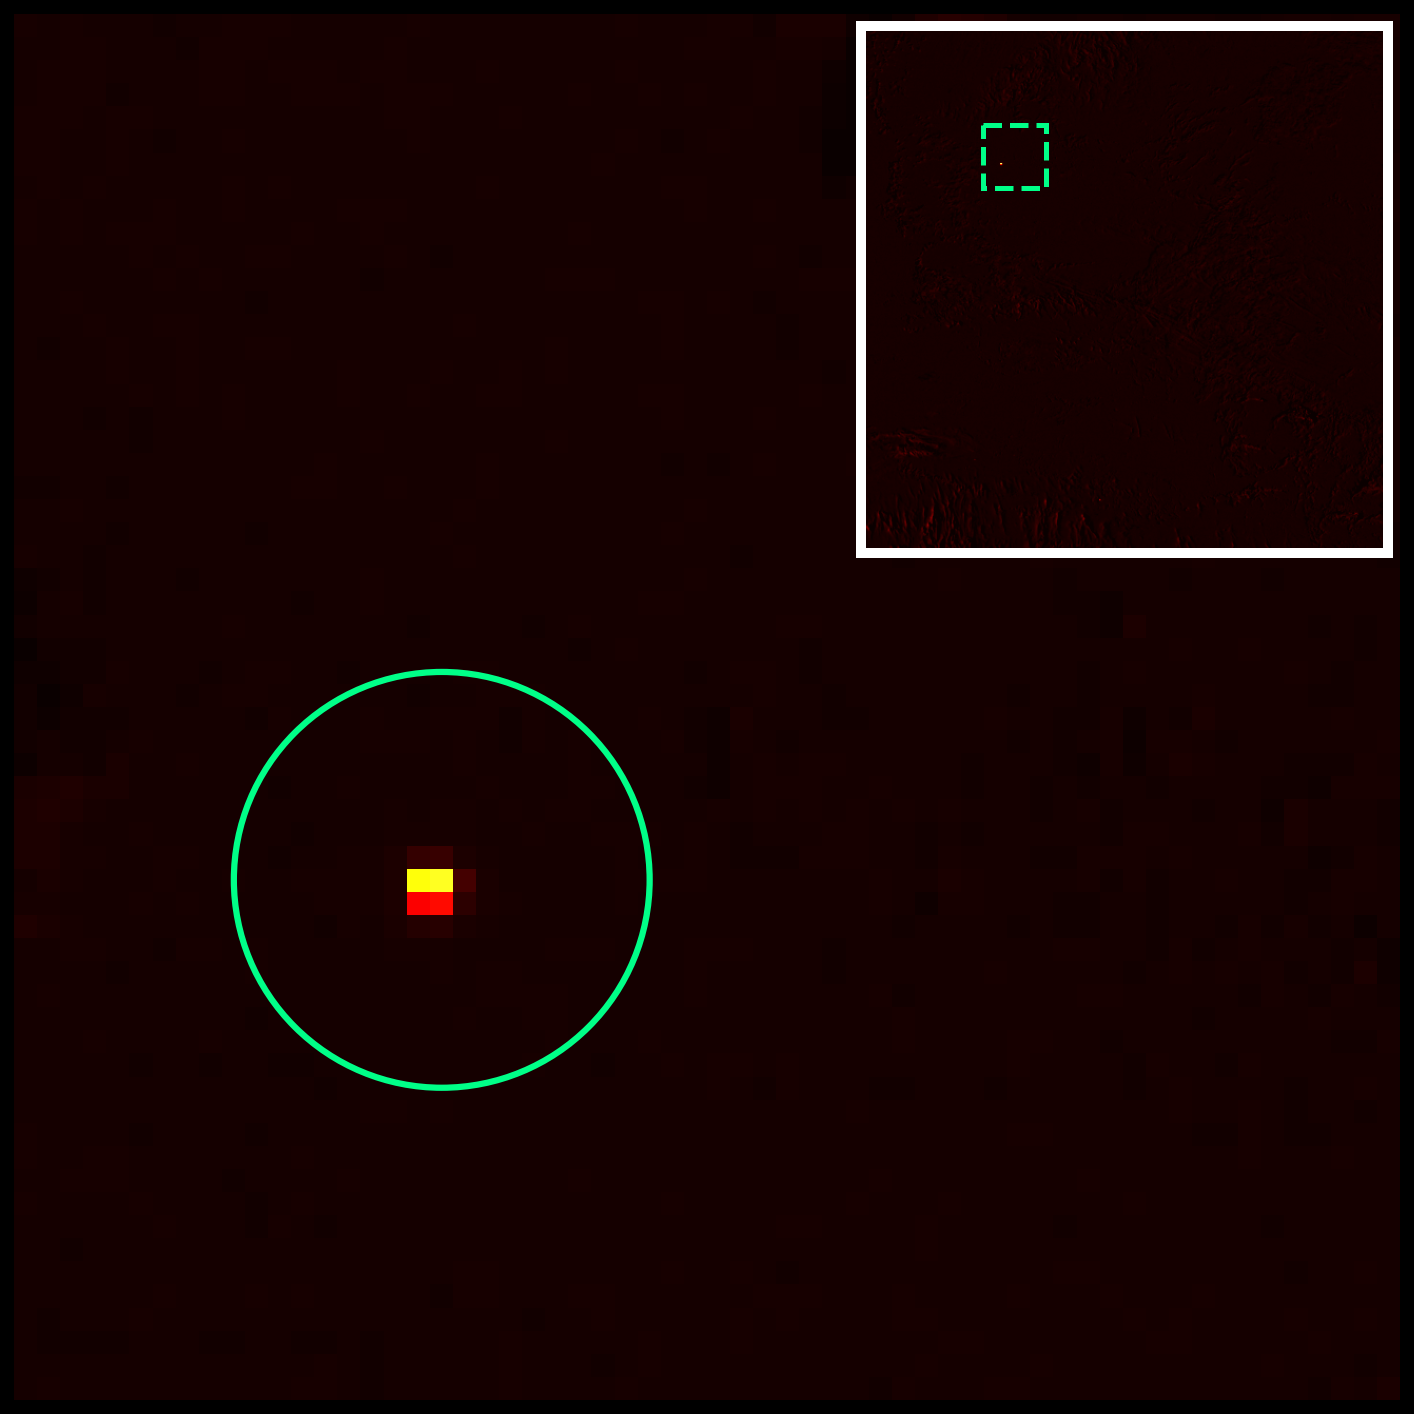
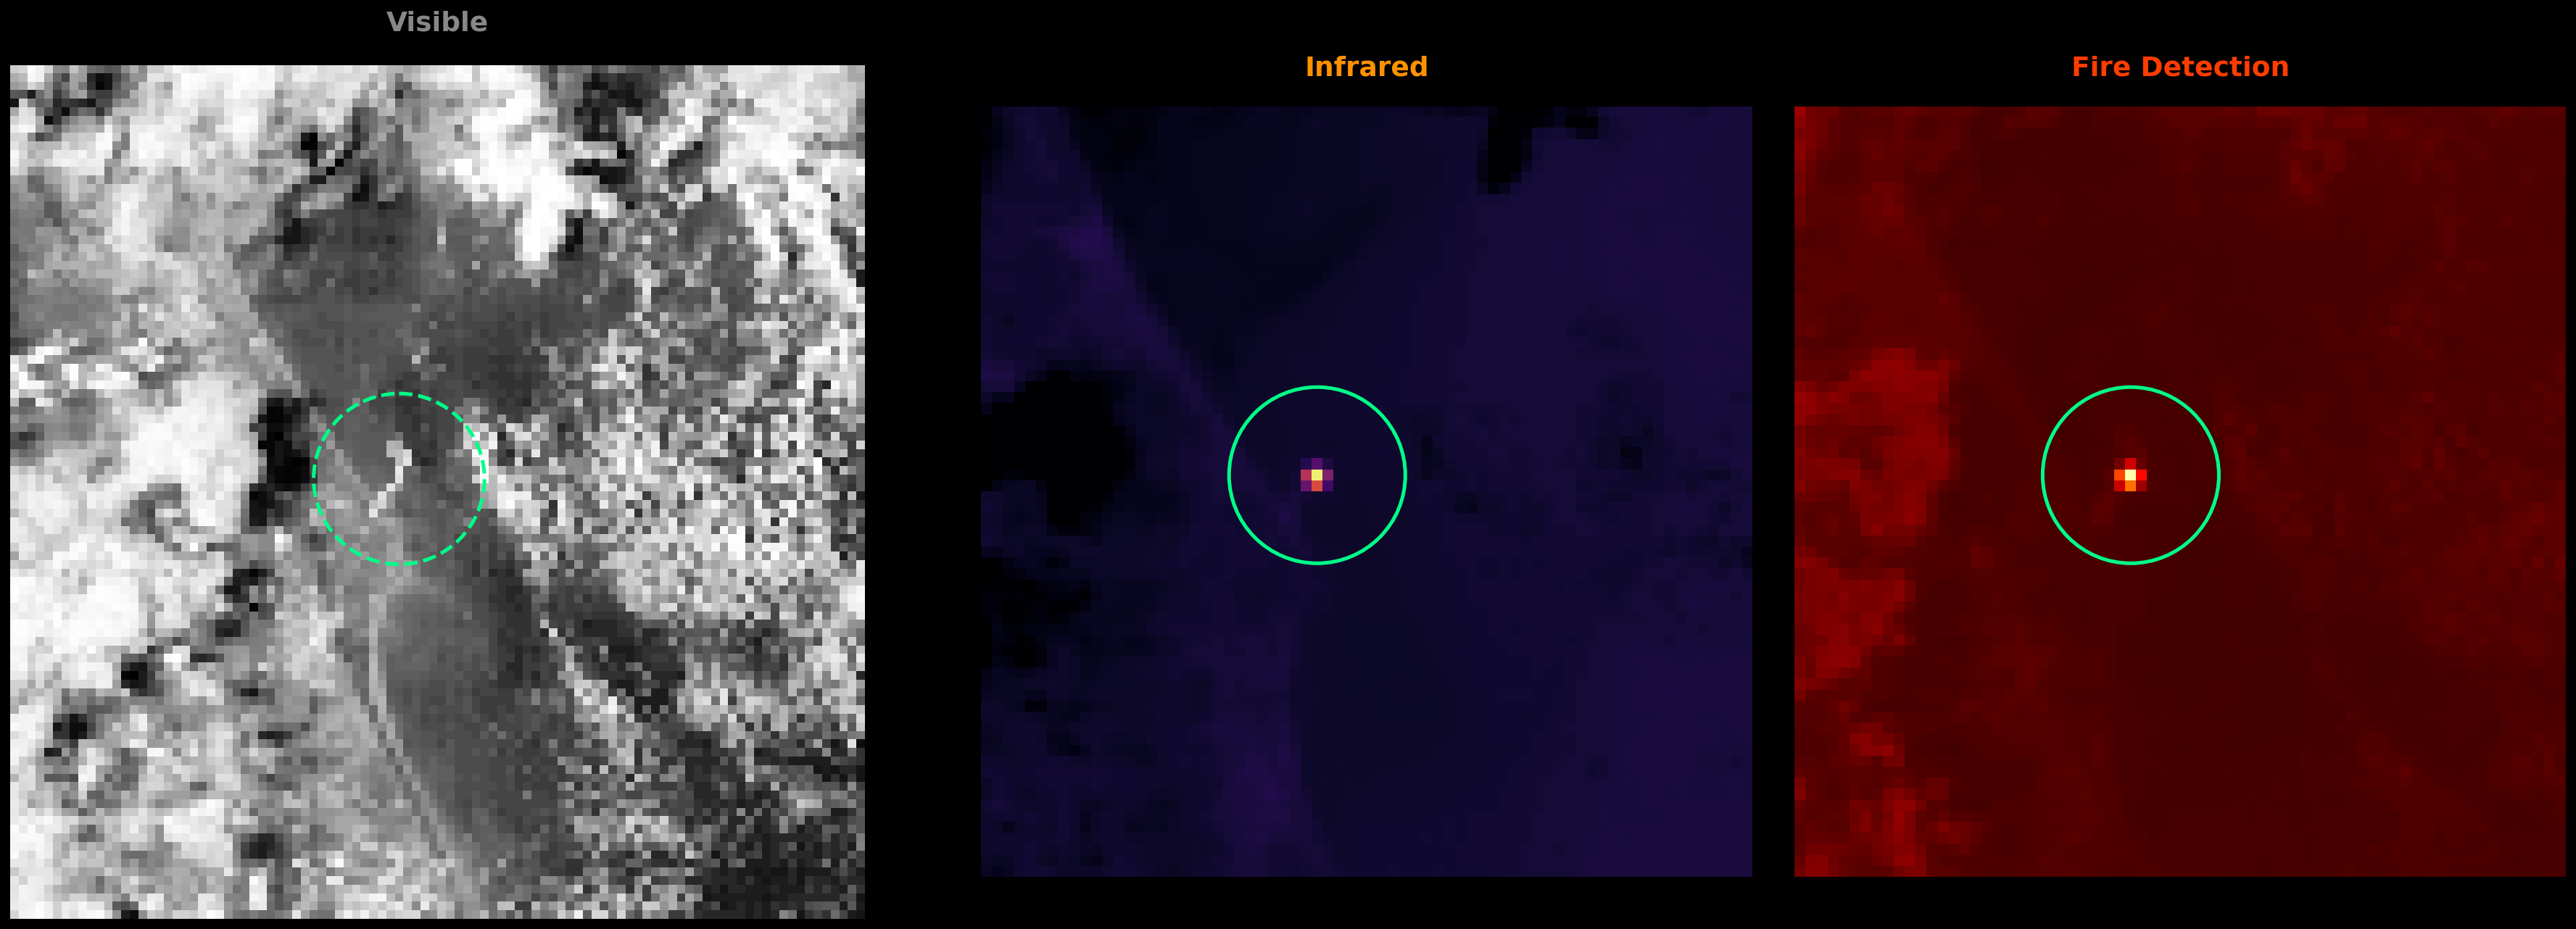
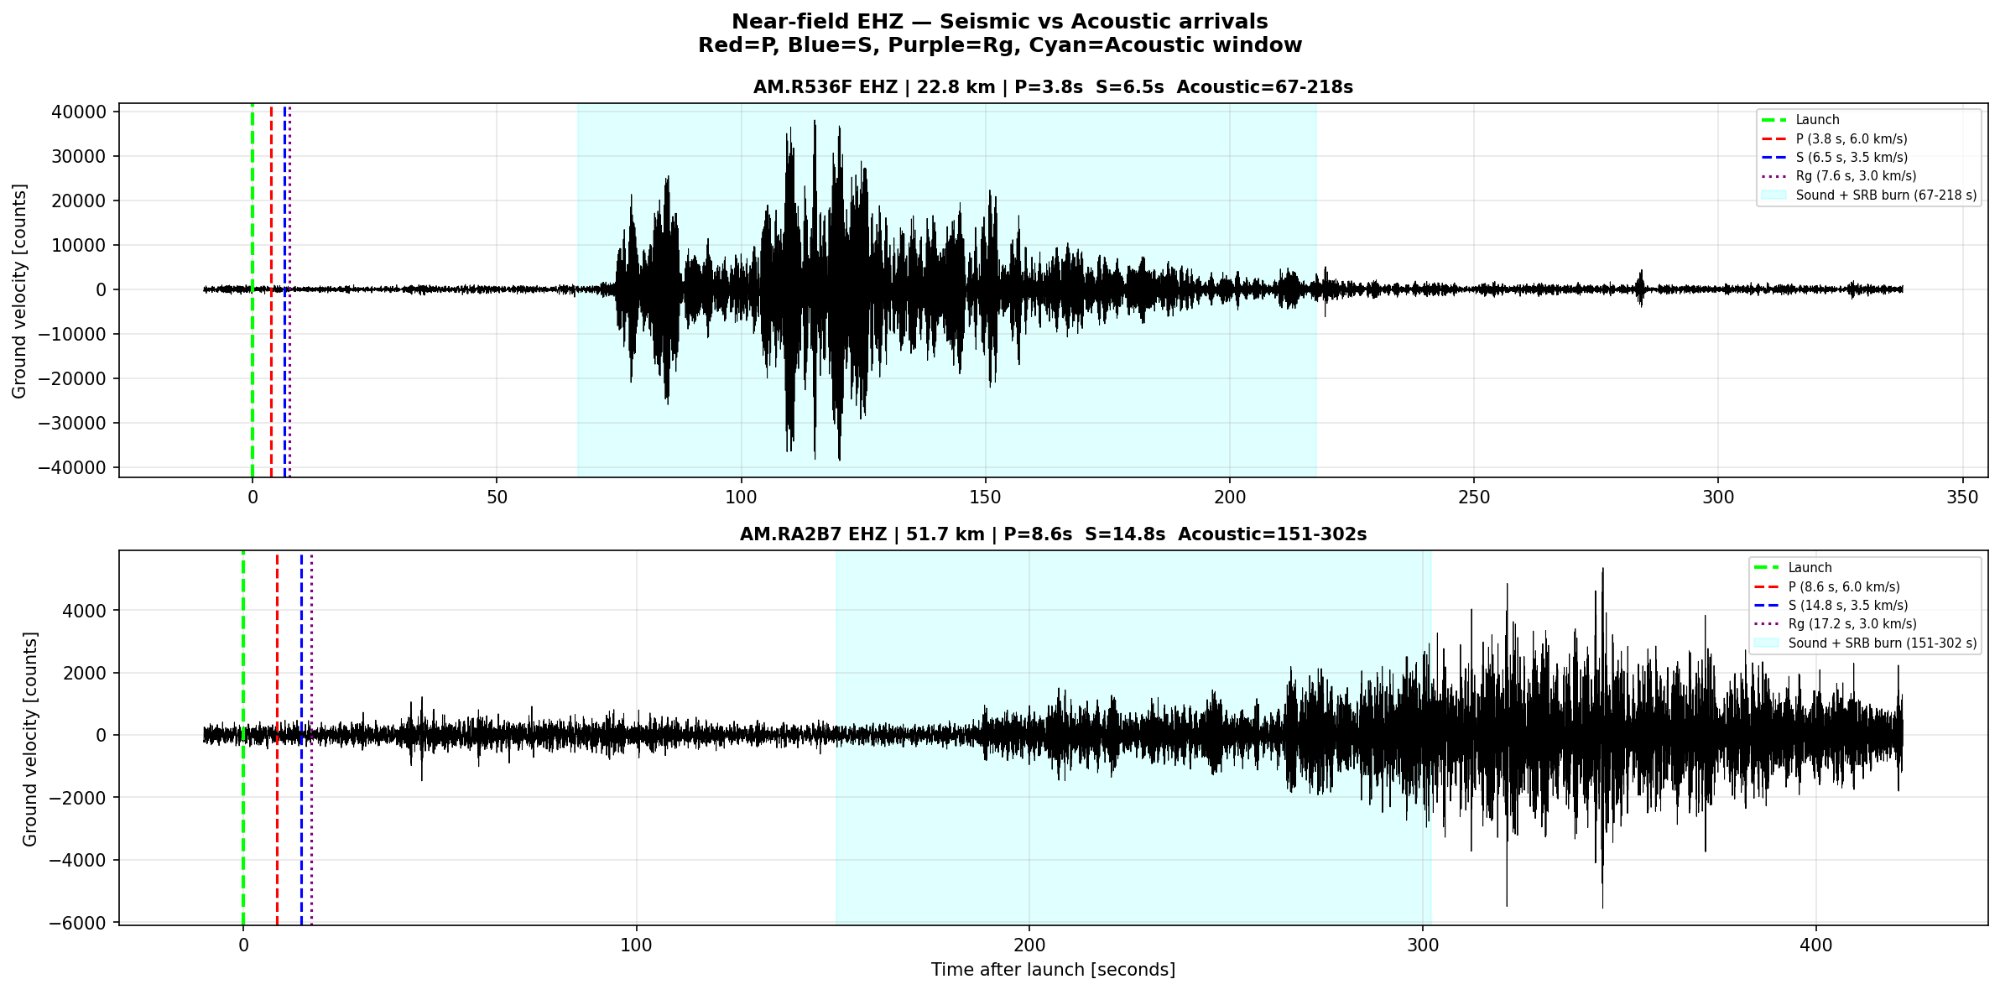
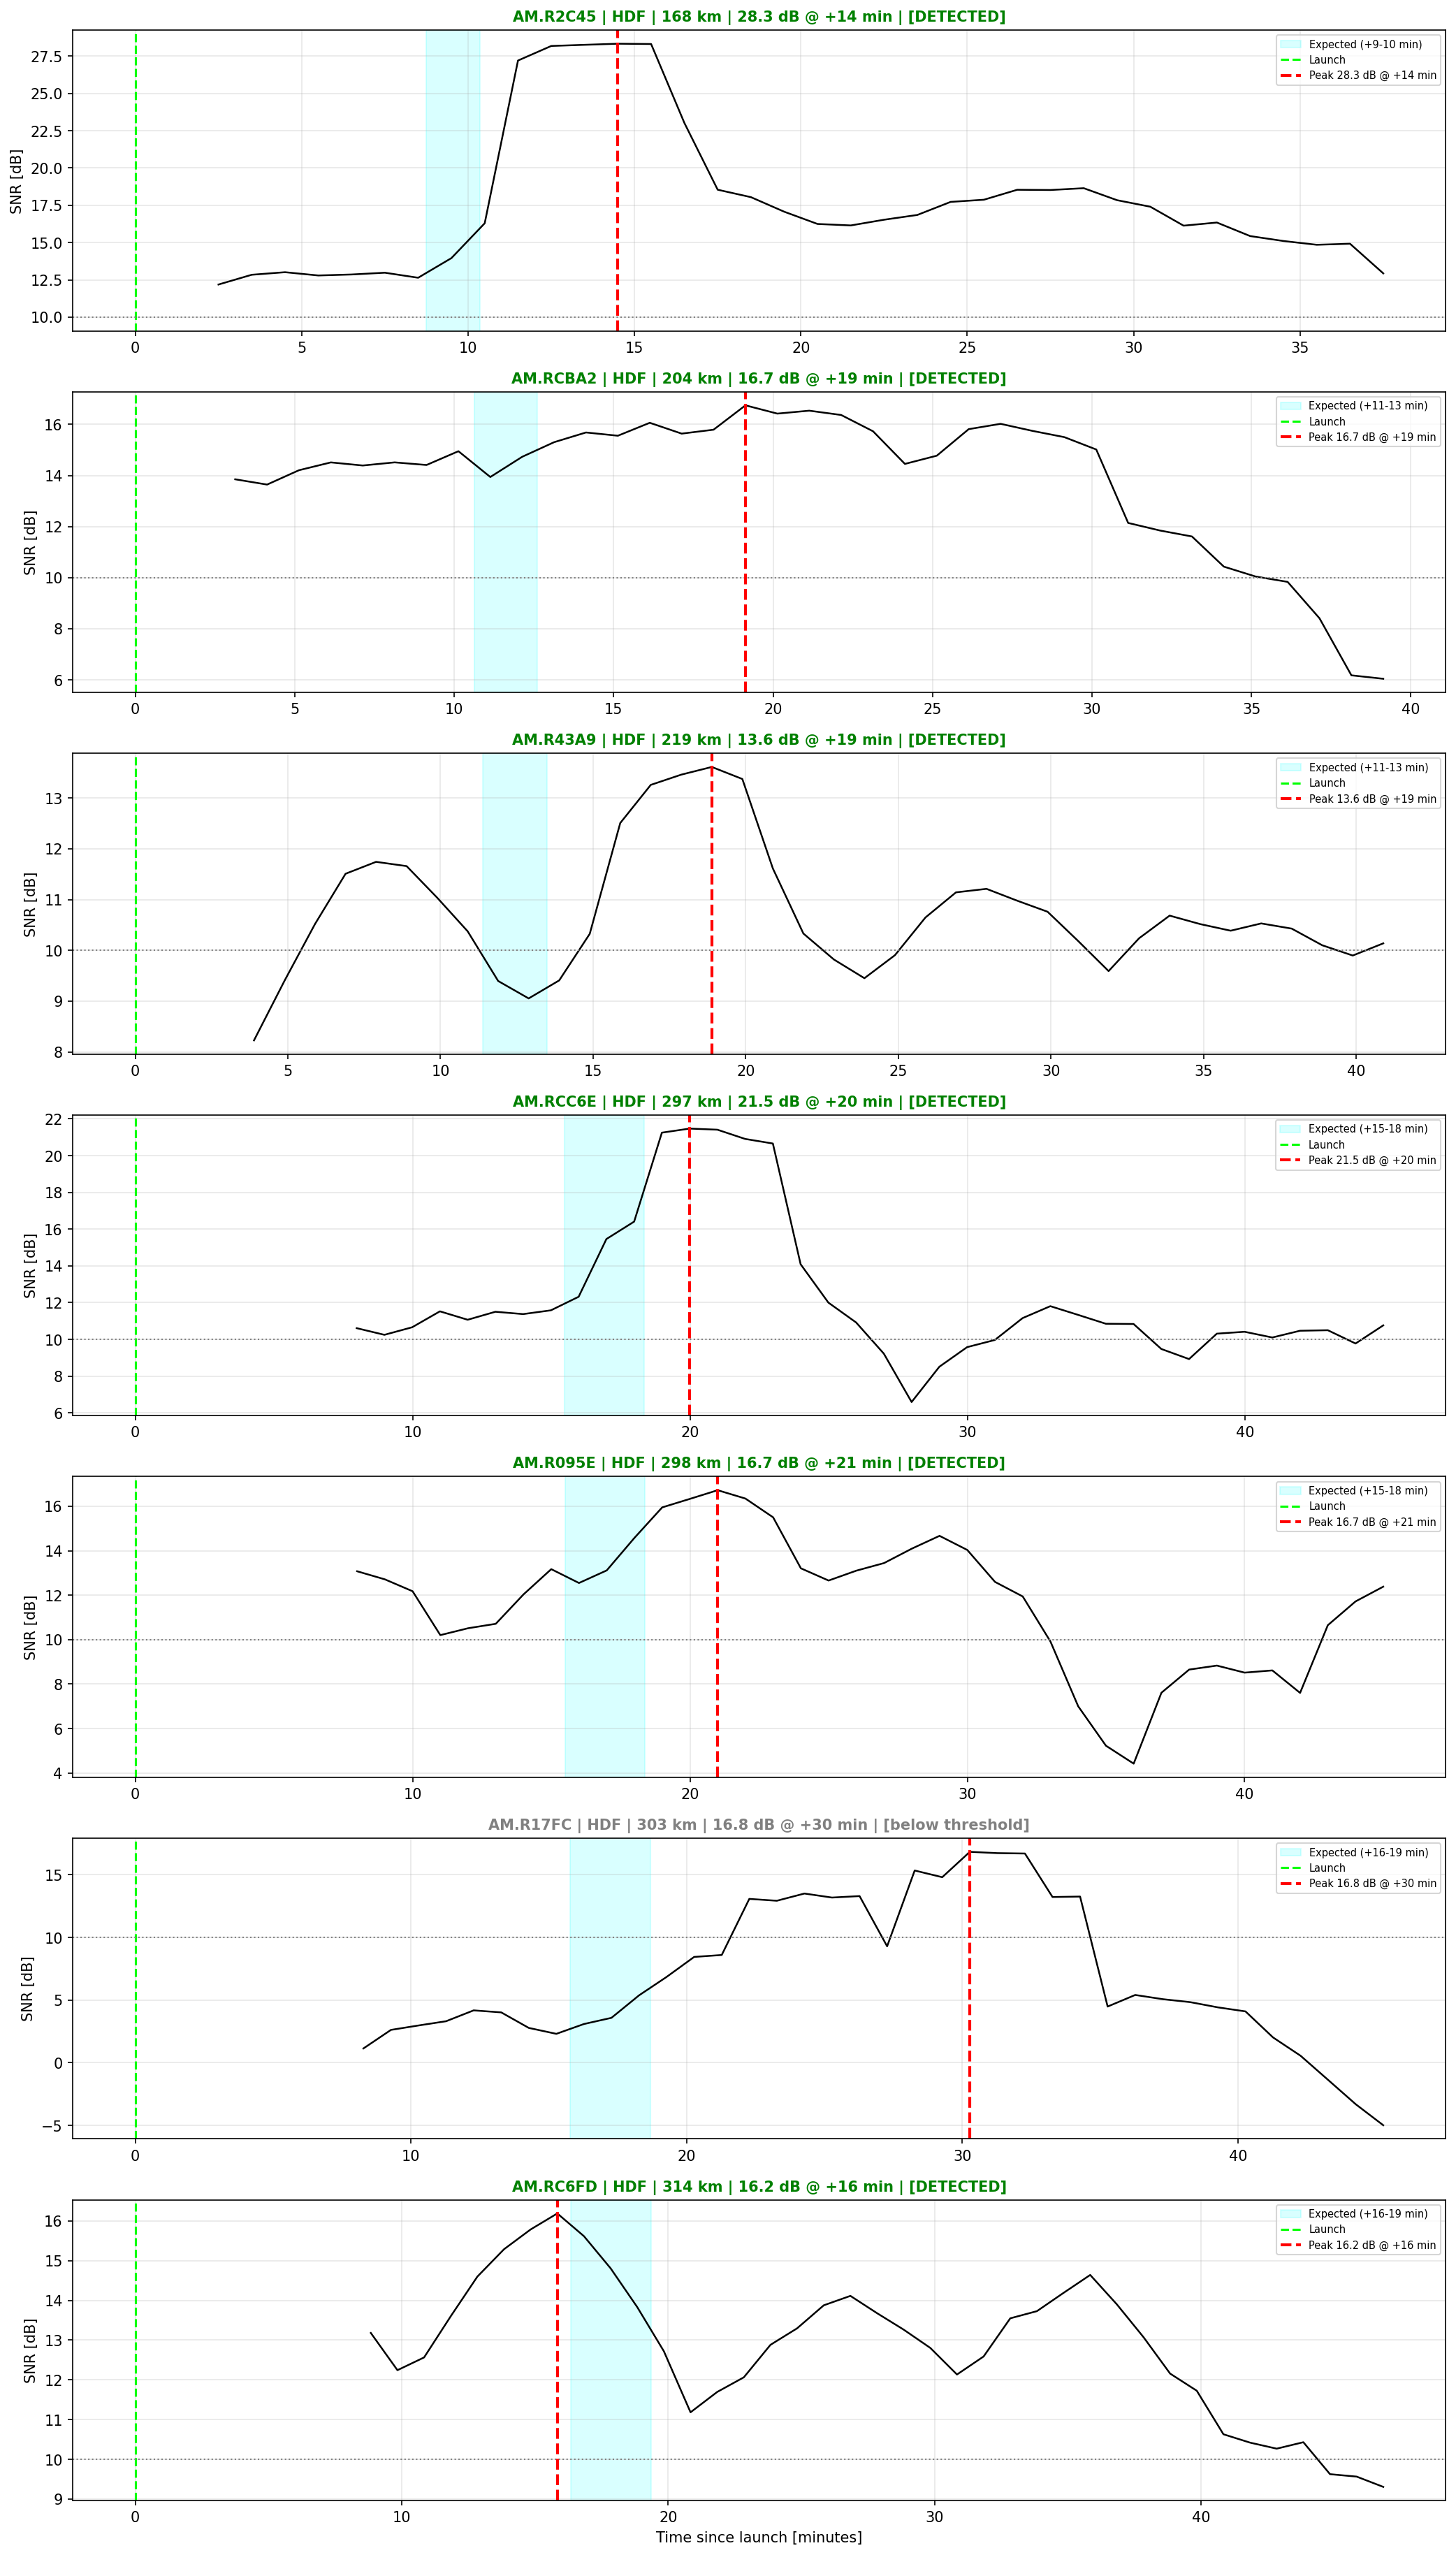
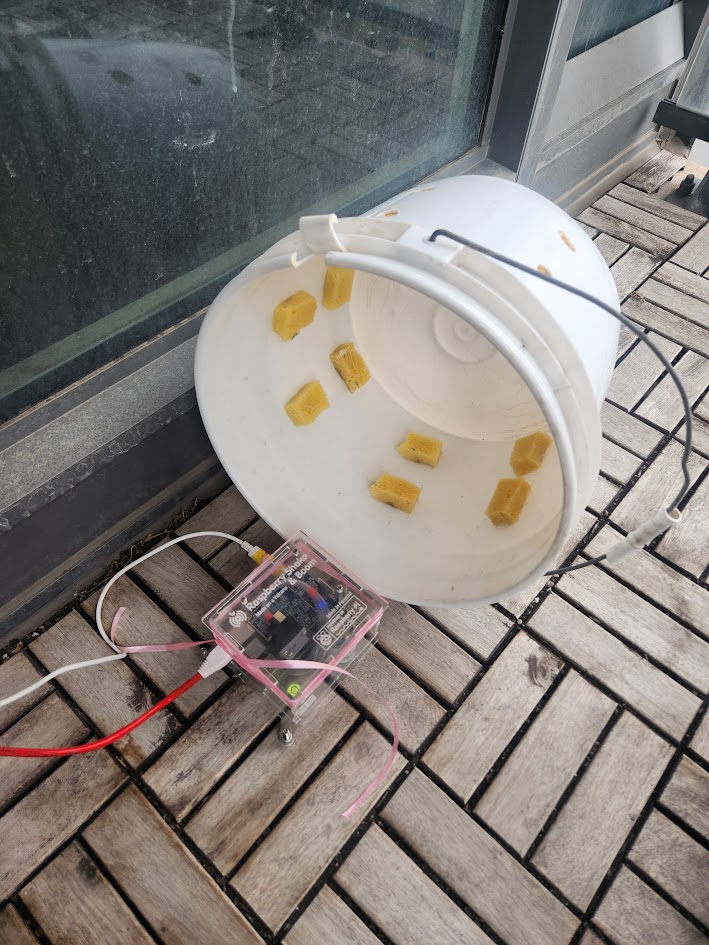
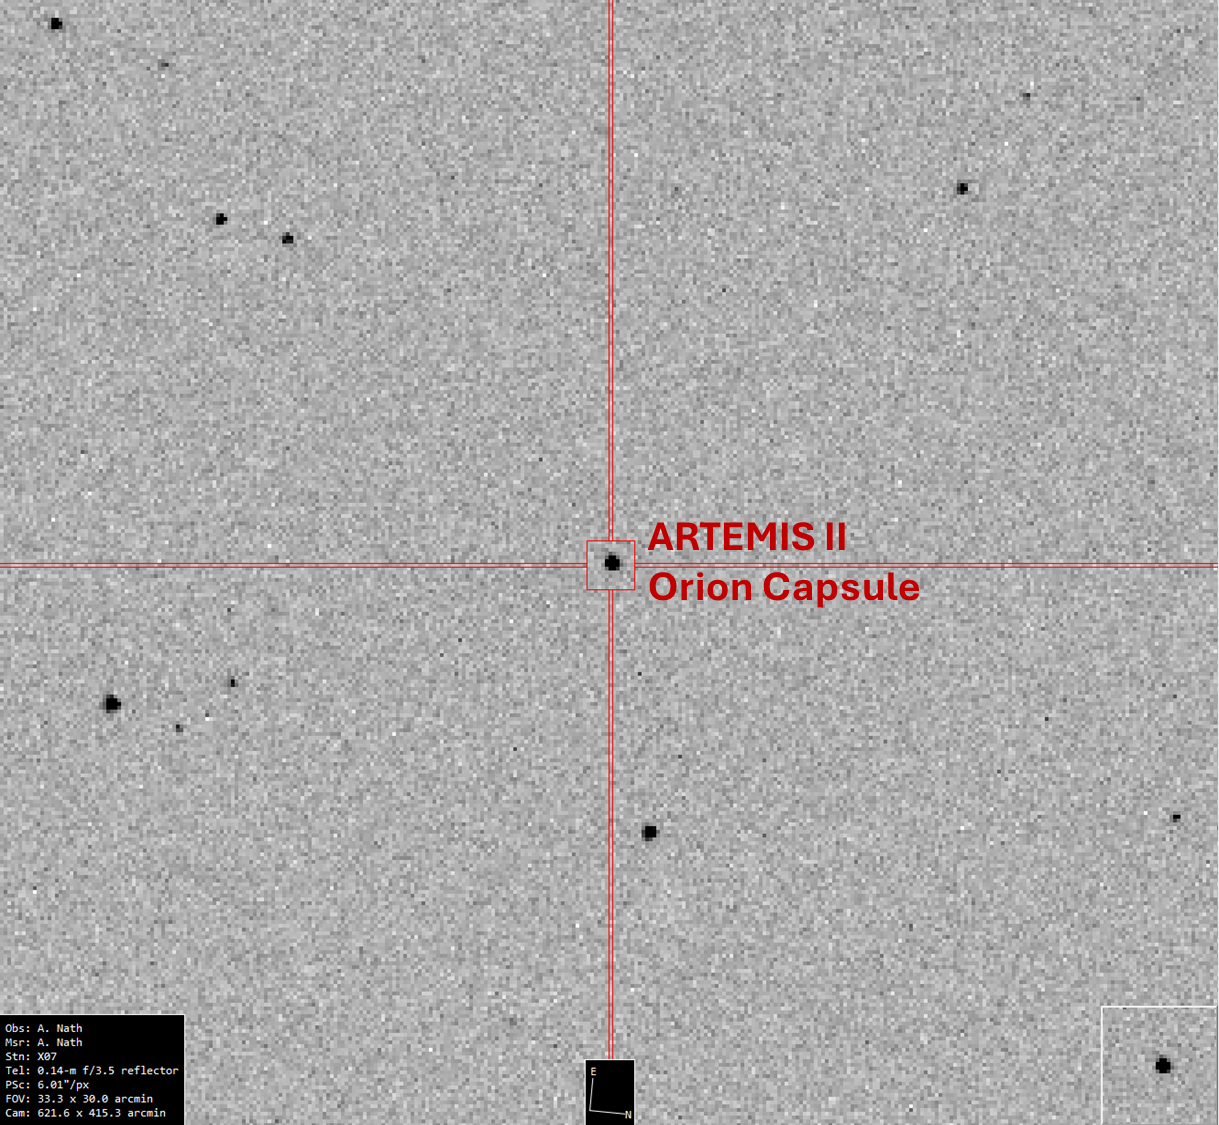
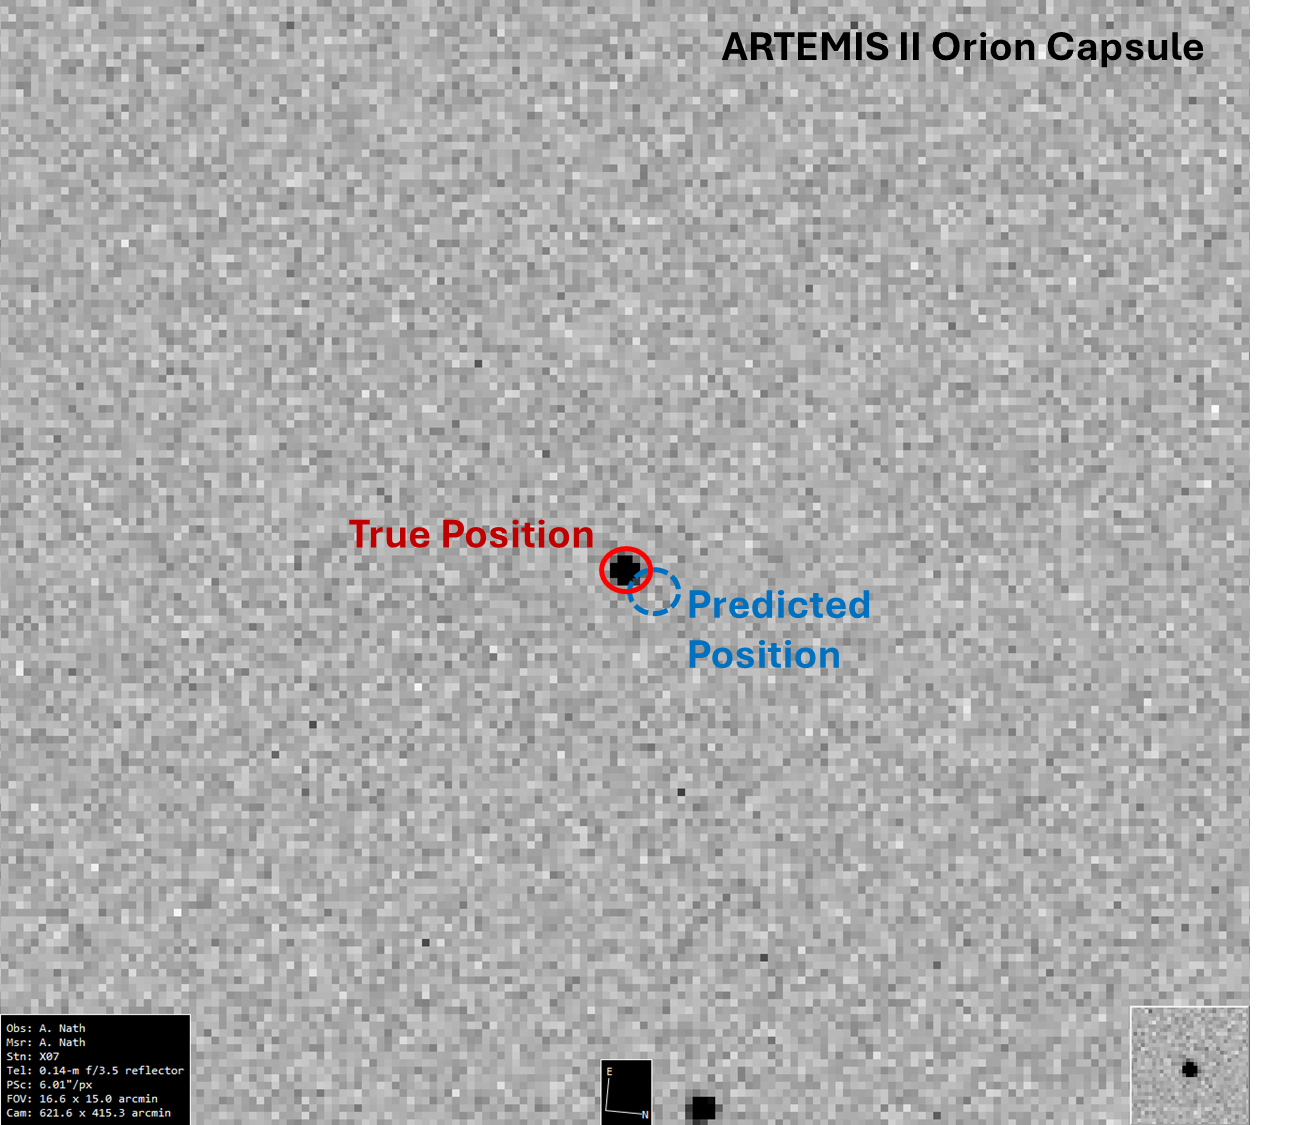
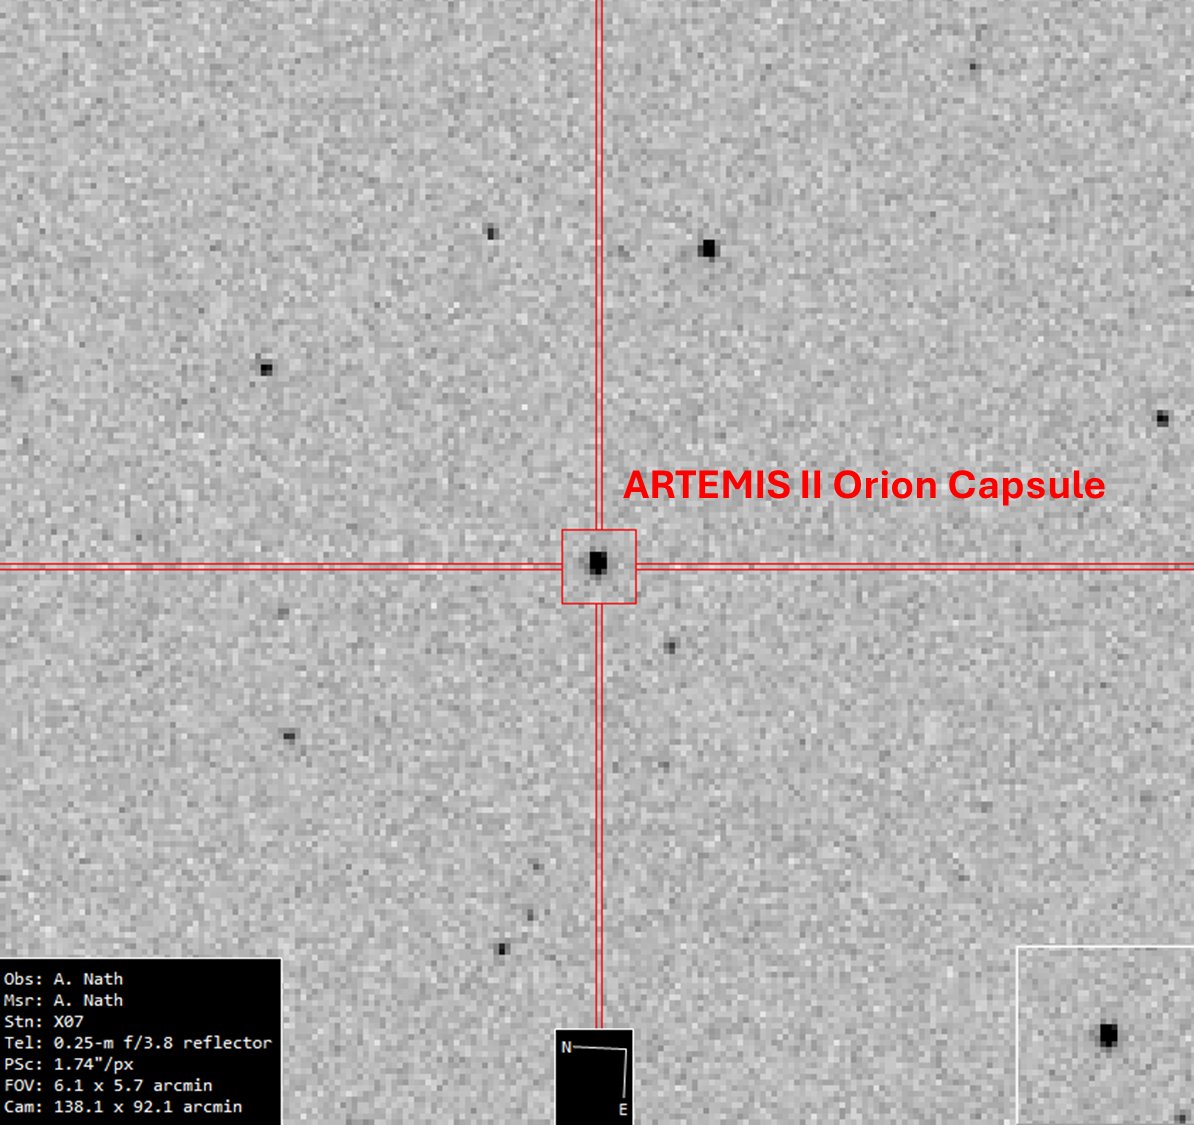
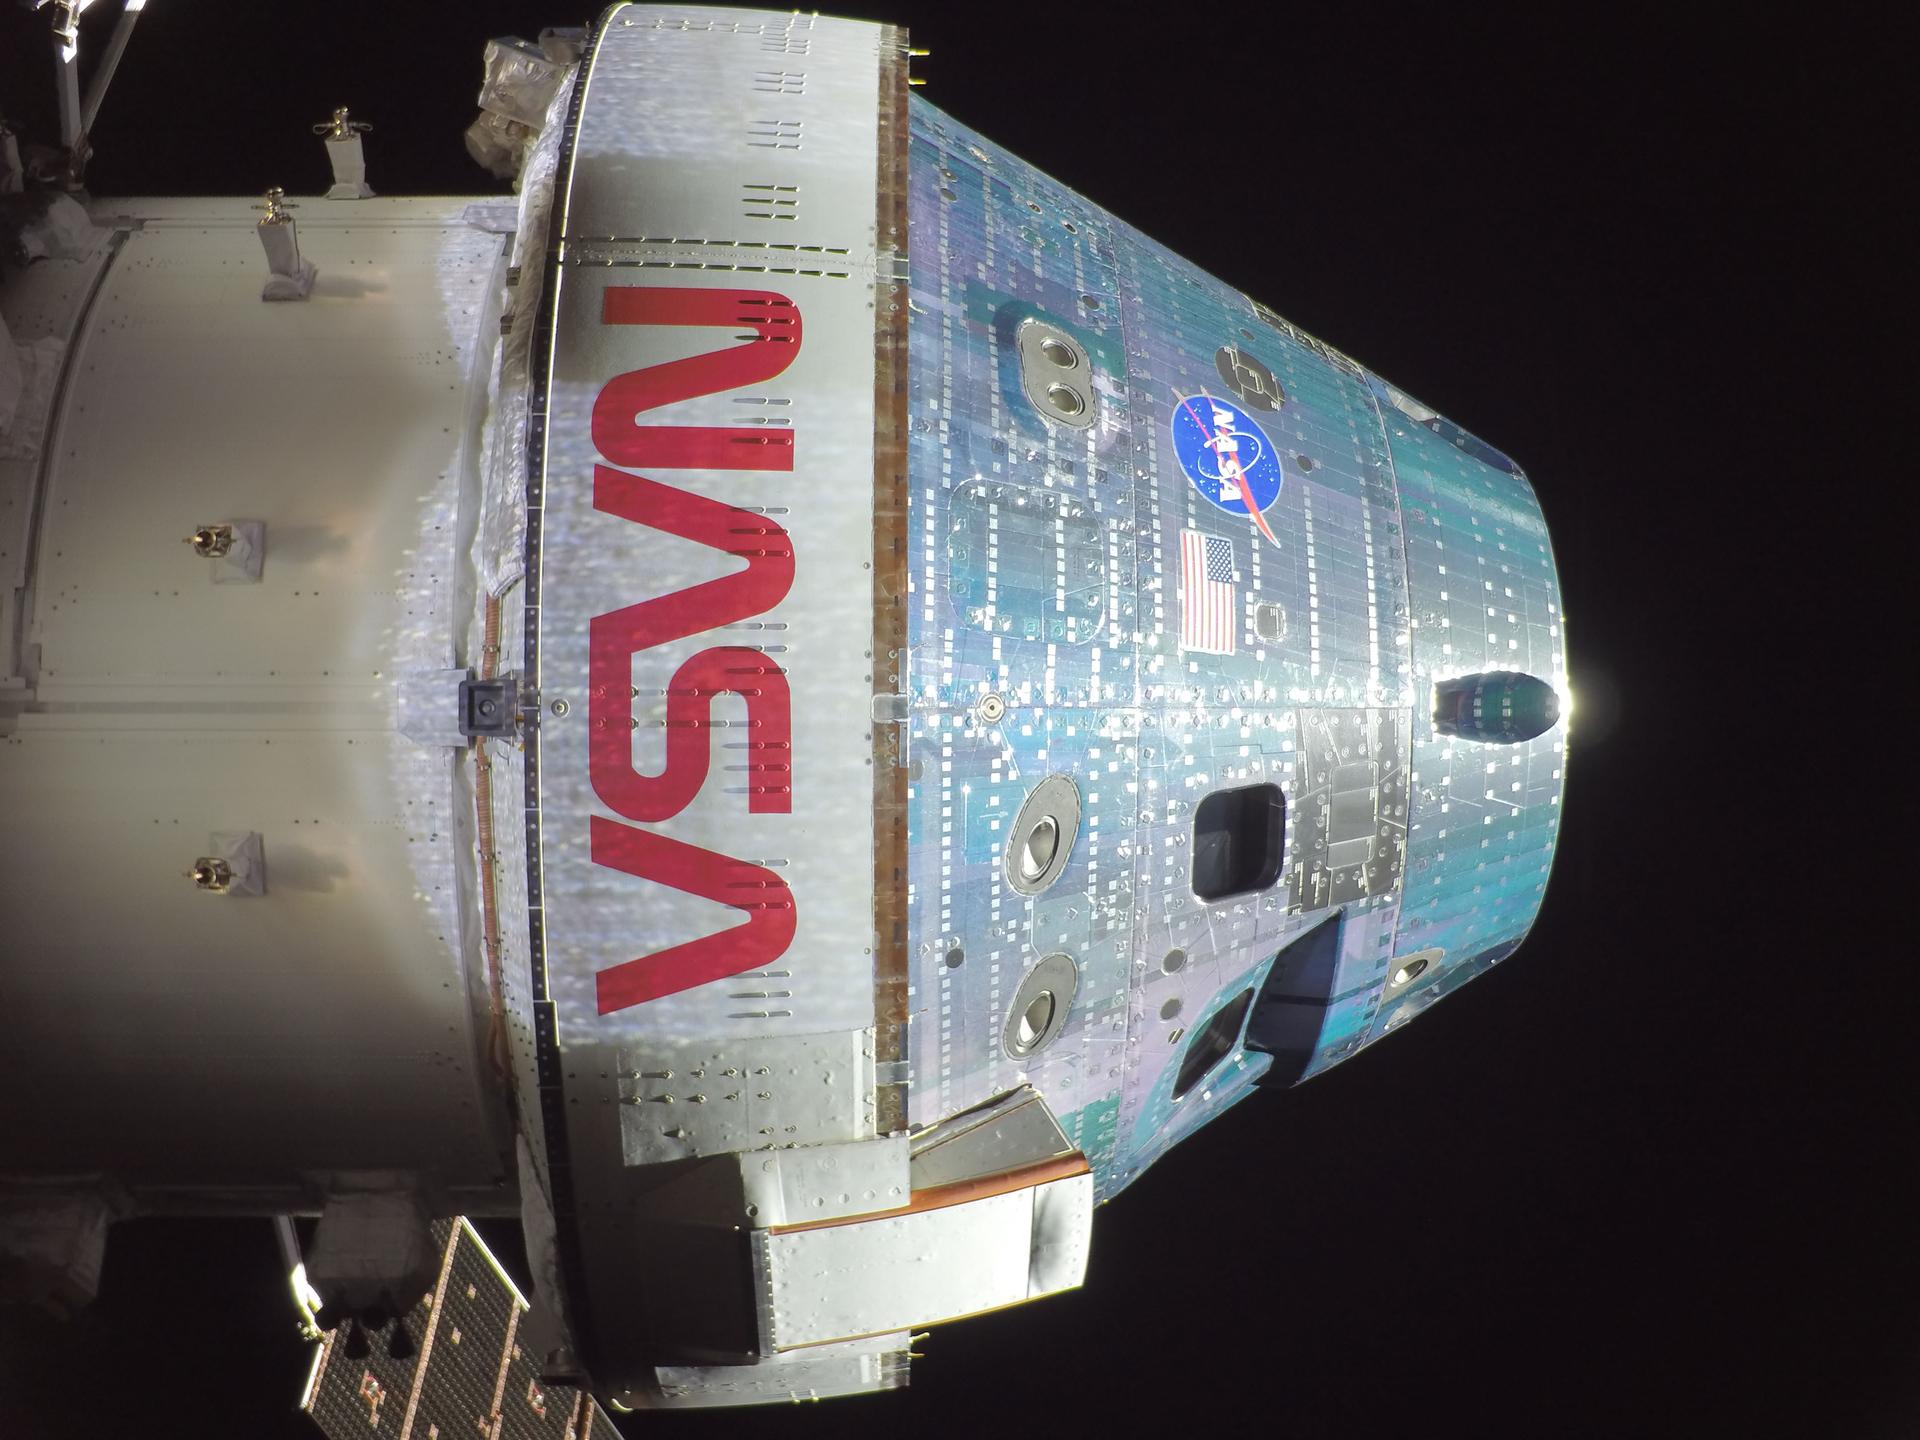
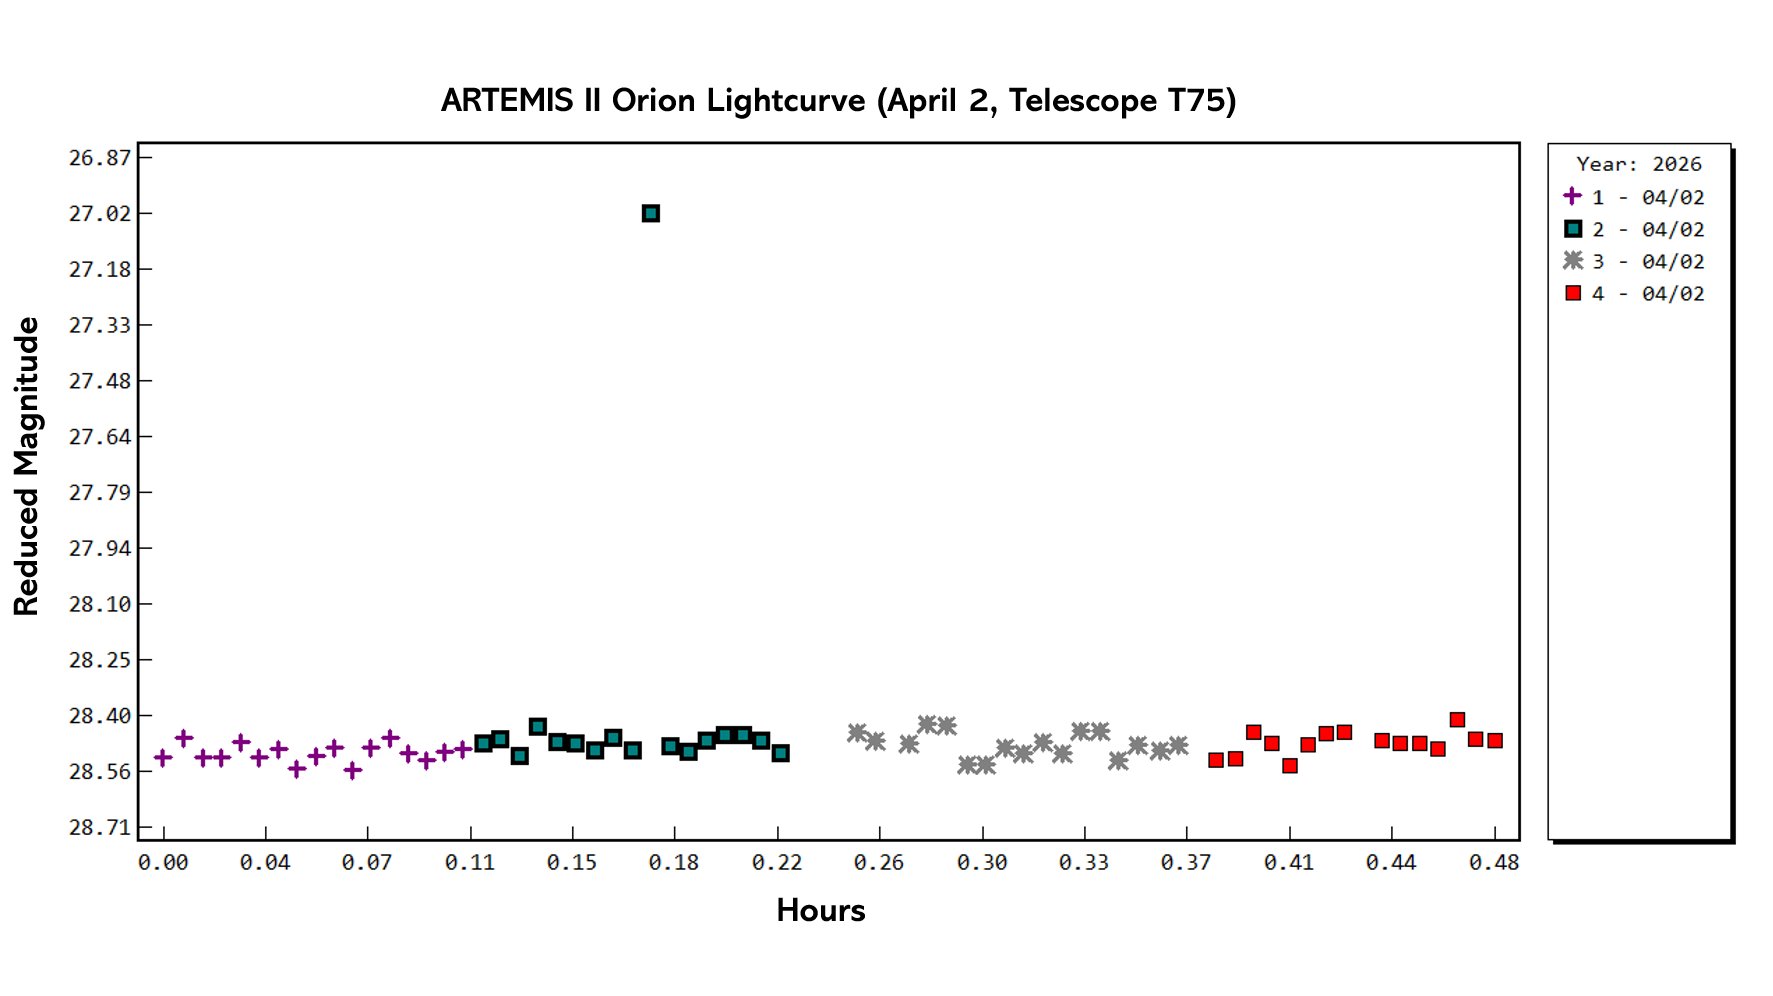
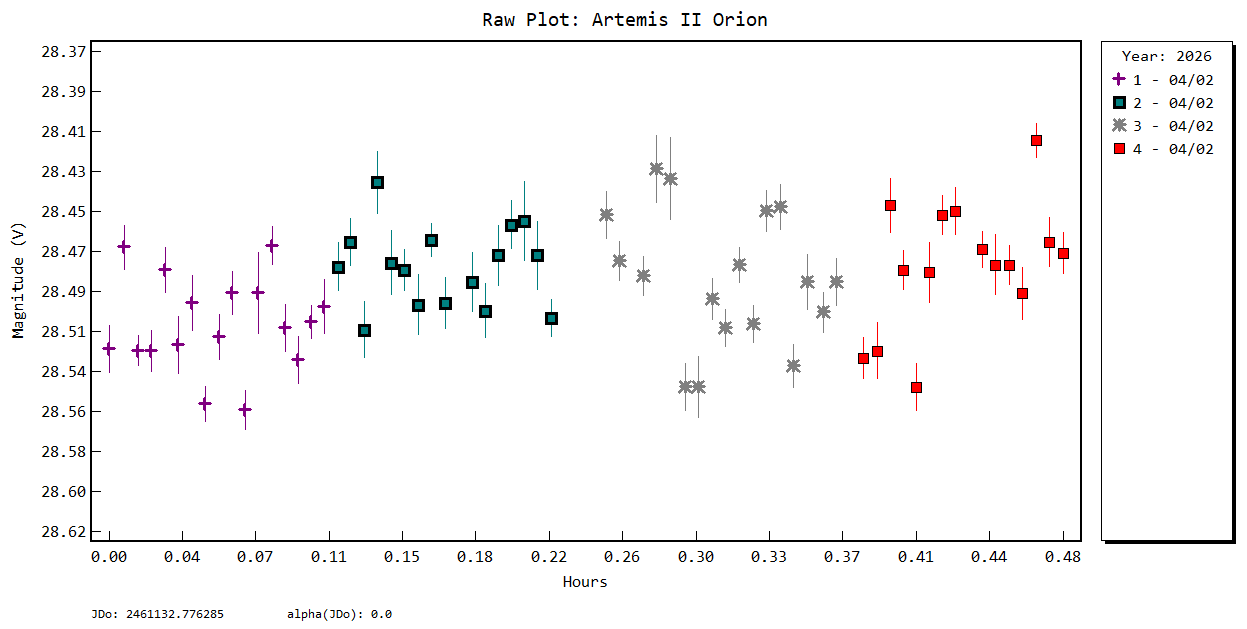
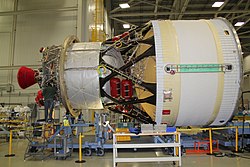
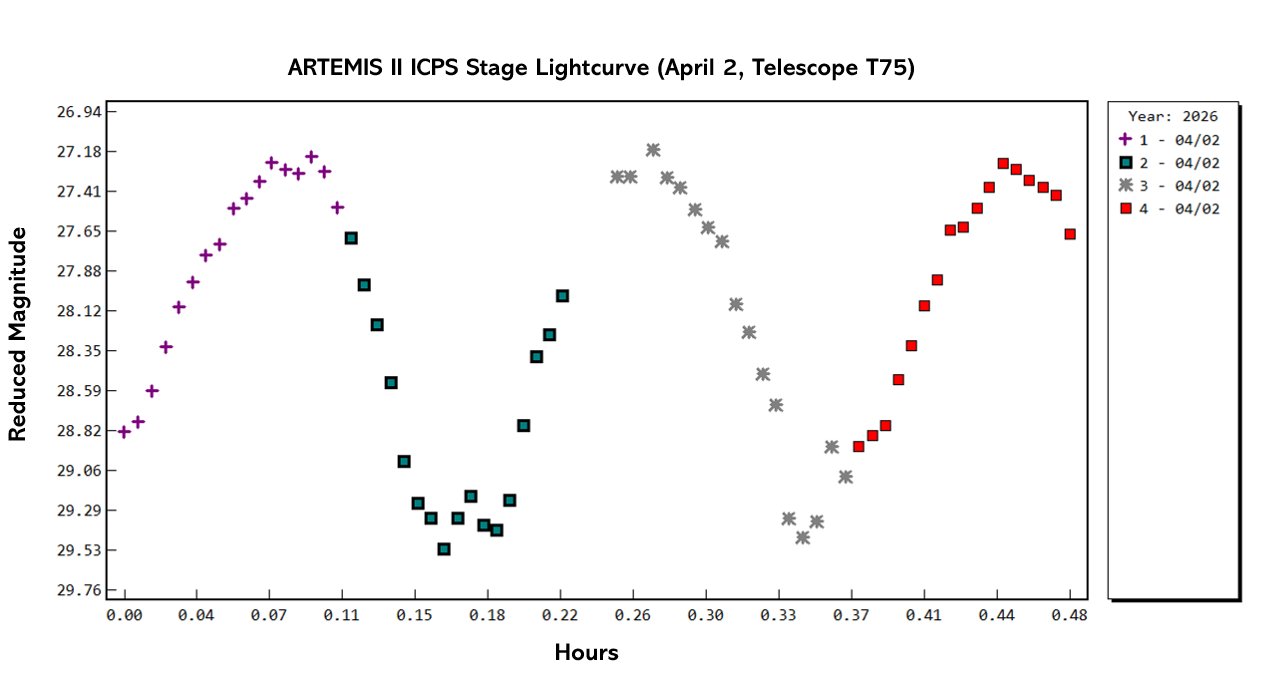
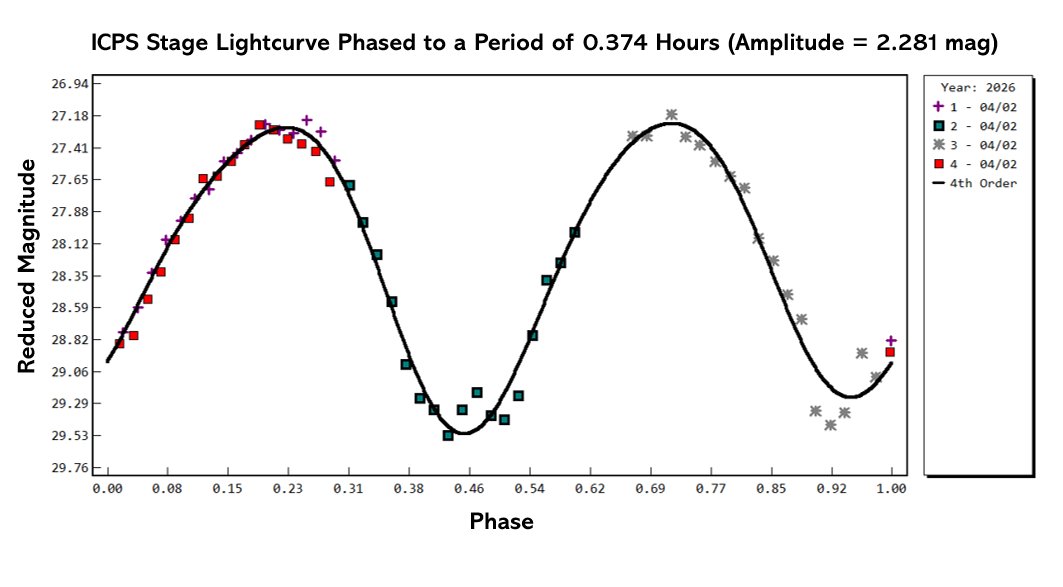
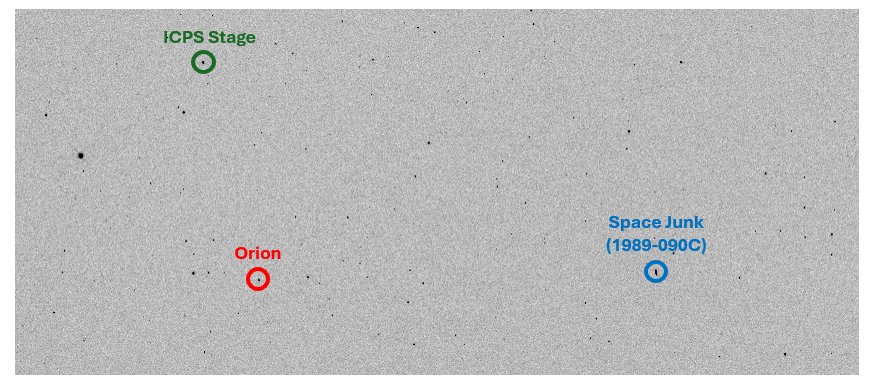
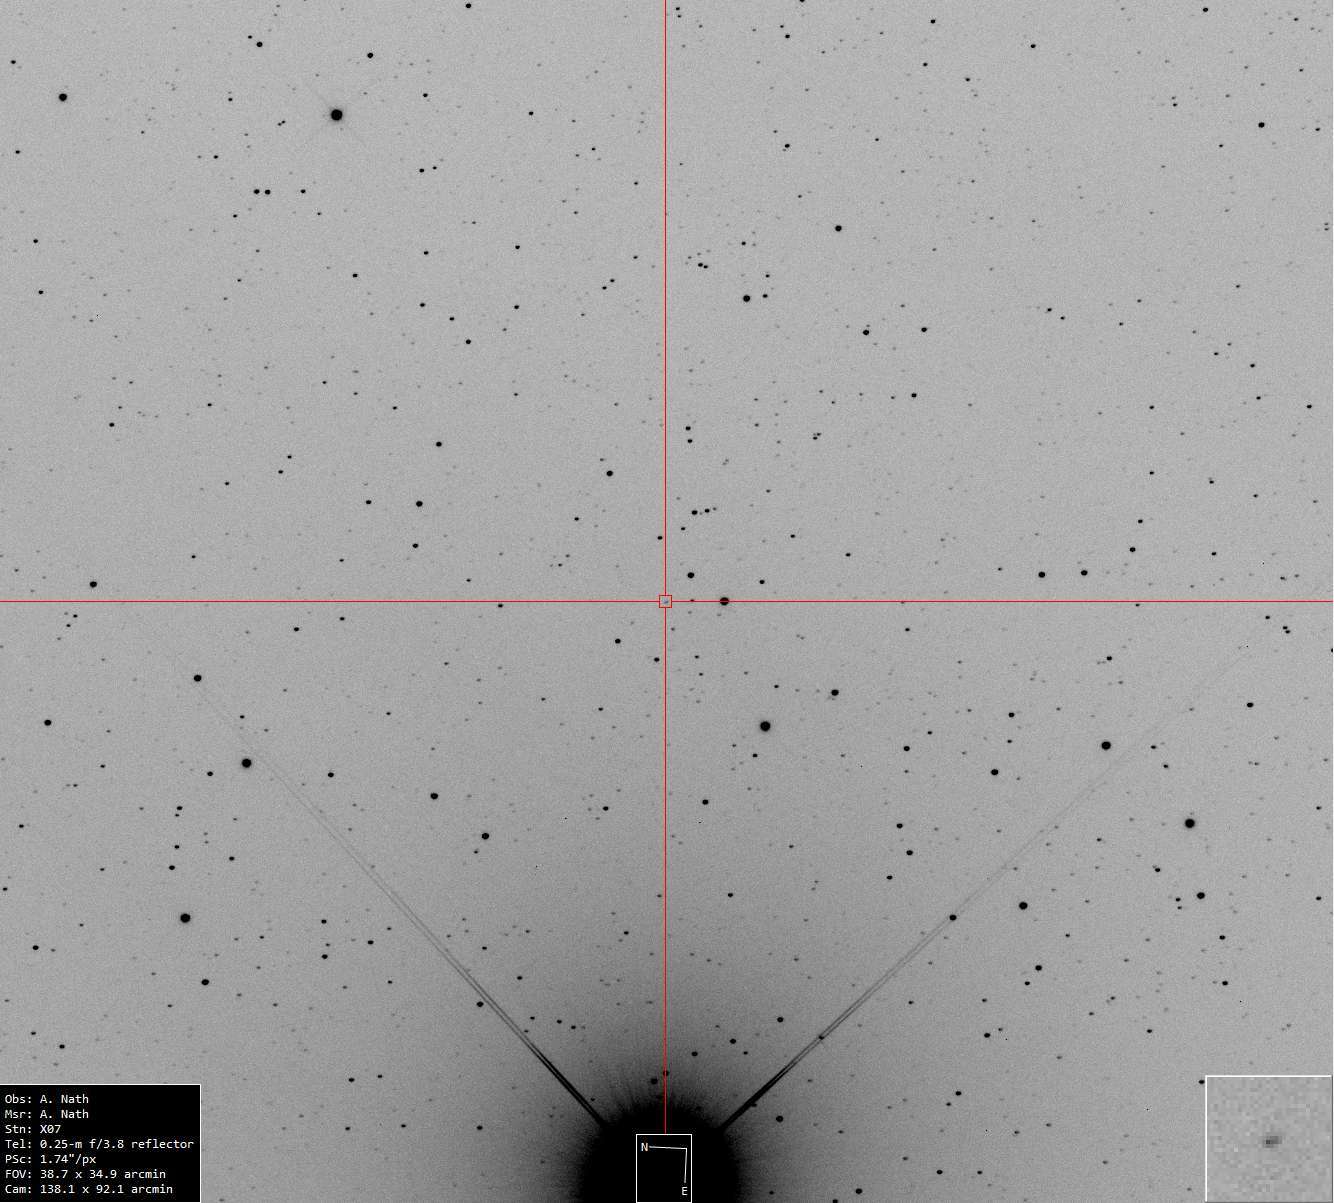
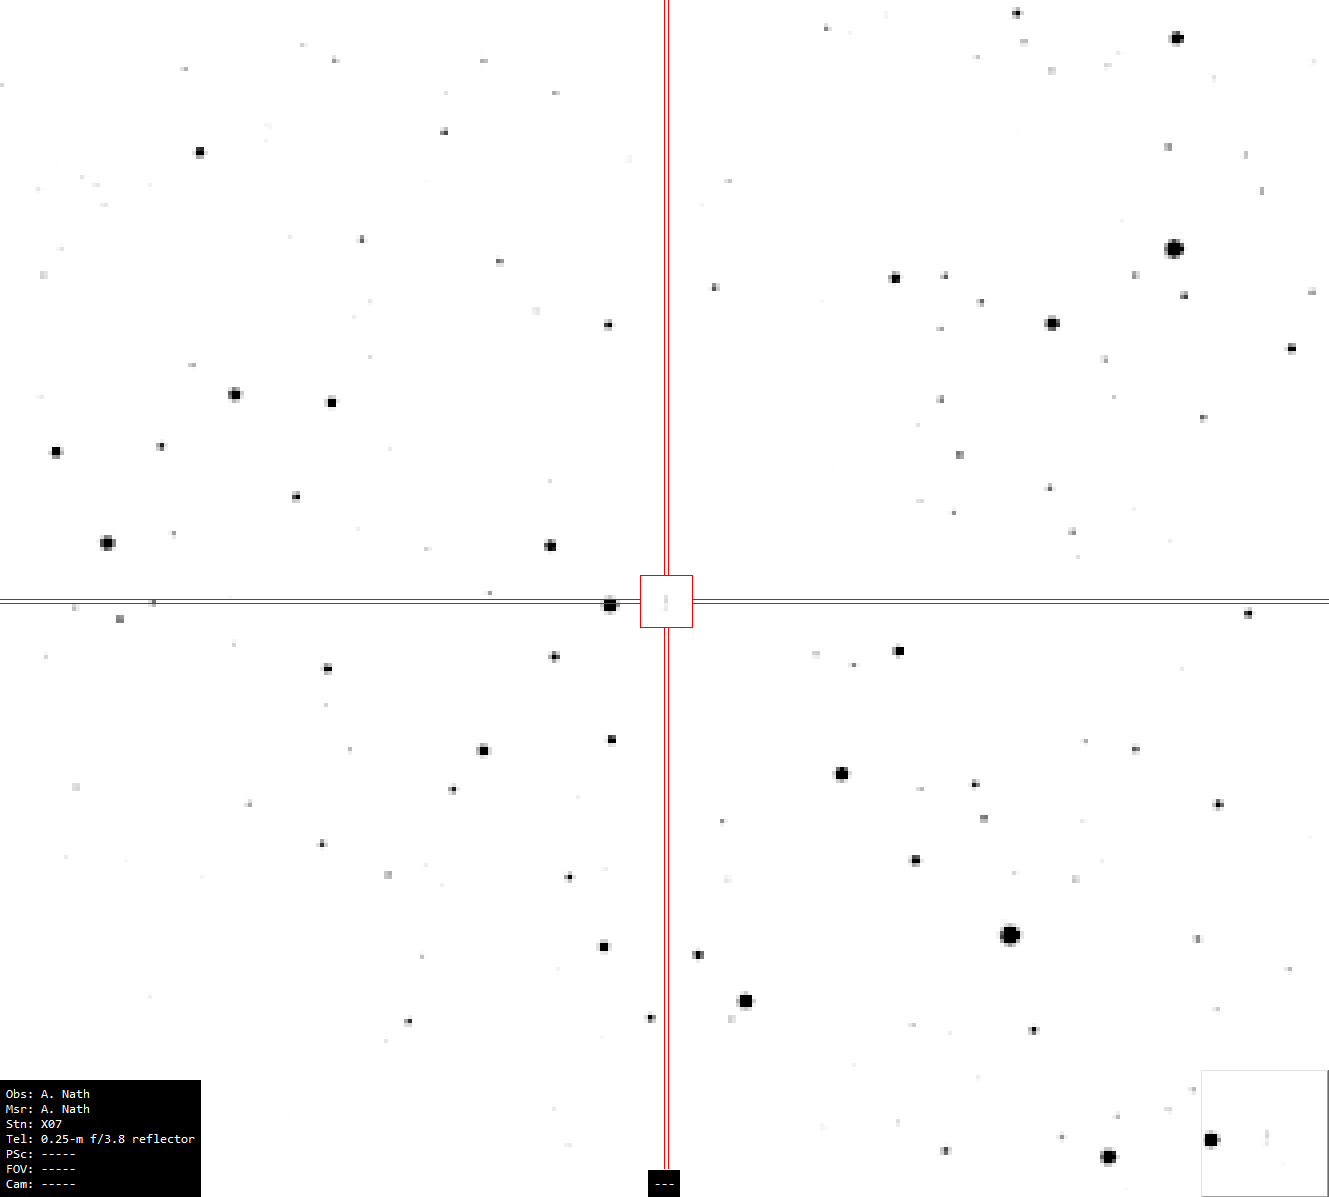
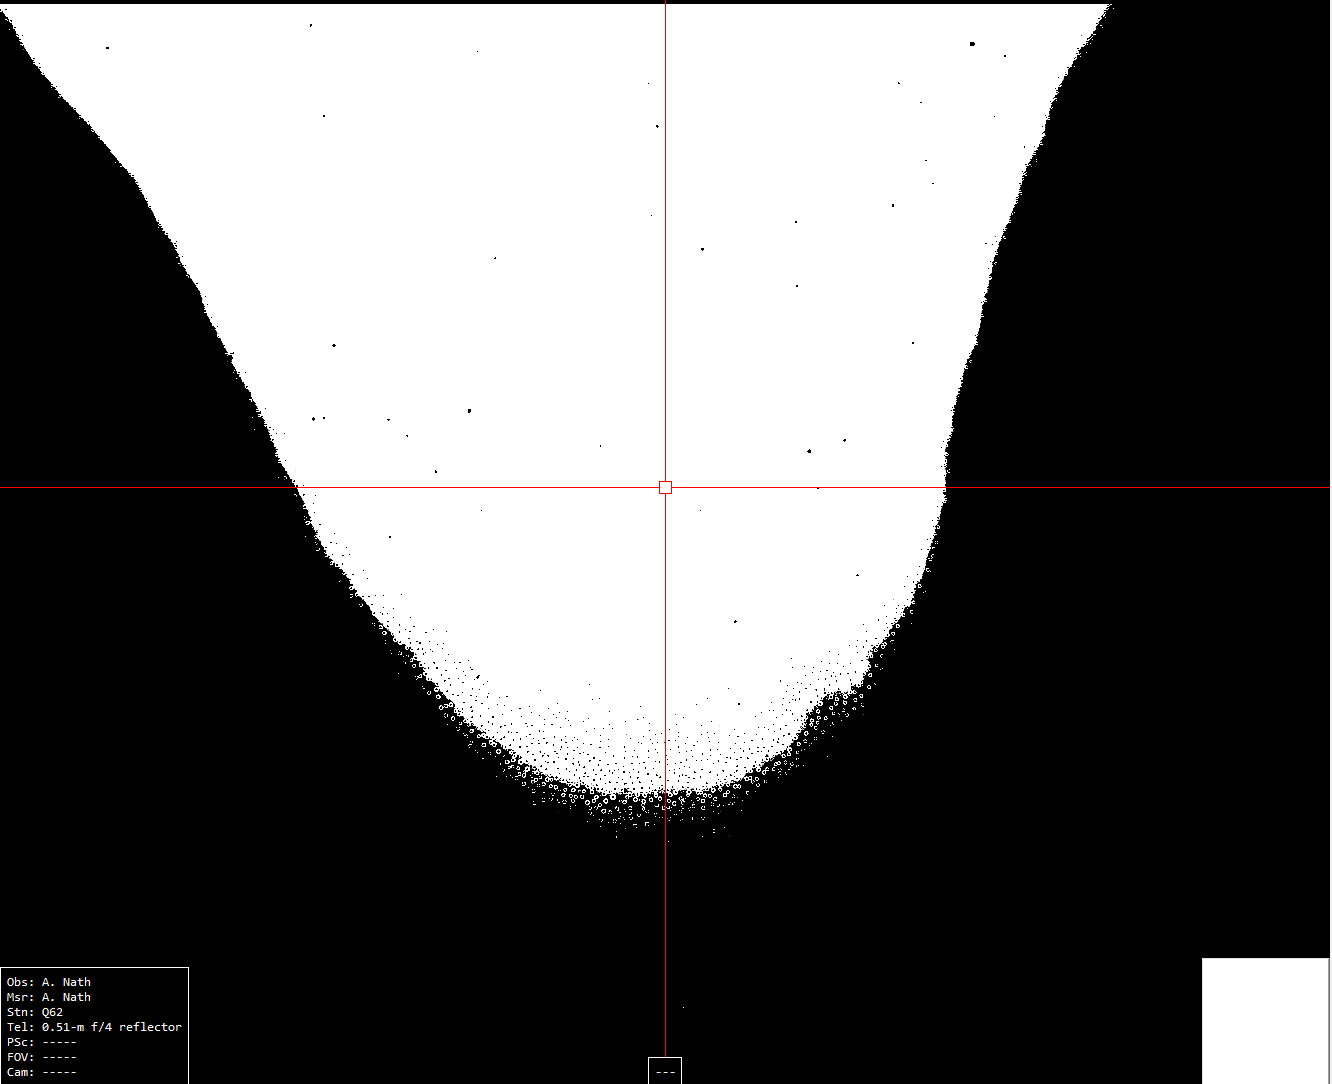
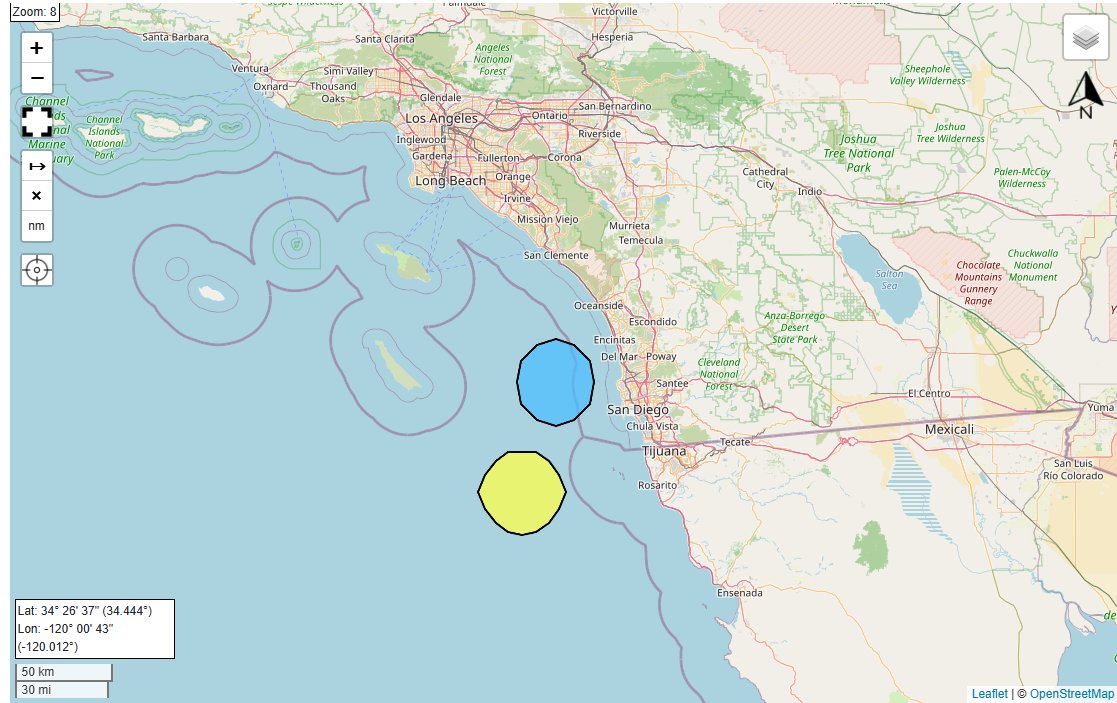
On April 1, 2026, NASA launched four astronauts toward the Moon aboard Artemis II. Using open data, open-source tools, and open science, I detected the rocket from space, tracked its exhaust, chased the spacecraft with robotic telescopes, and listened for it with seismic and infrasound sensors.
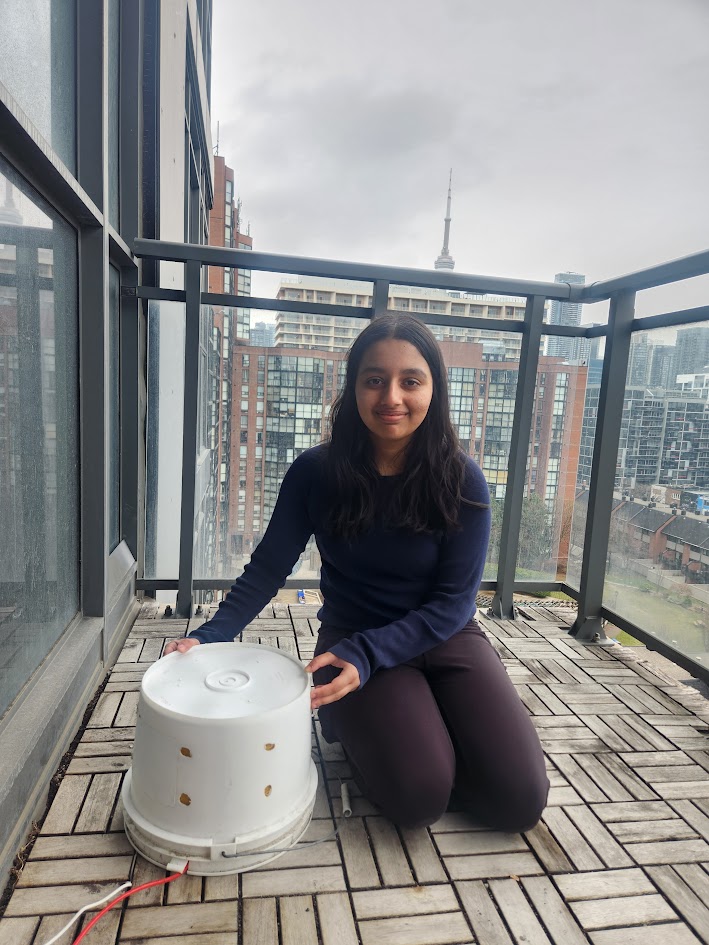
Arushi Nath, Grade 11 Student · Toronto, Canada
arushi@monitormyplanet.com · 𝕏 @wonrobot

Arushi Nath with telescope on her Toronto balcony
Remote SensingSeismicsInfrasoundAstrometryPhotometryDebris ID
Artemis II flight path
Artemis II trajectory · NASA/Goddard
Global Observation Network
4 telescopes, 4 satellites, 25+ seismic and infrasound sensors across 4 continents
Launch site Telescopes IMS infrasound arrays Broadband seismic Raspberry Shake Raspberry Boom Rings: 100 · 320 · 1,580 · 3,500 km from KSC
SLS launch
T − 2 days
Mar 30
0 km
On the pad
Remote Sensing

Capturing Artemis SLS at Launch Pad 39B

Two days before launch. I downloaded ESA's Sentinel-2C imagery of Kennedy Space Center at 10 metres per pixel via the STAC API. You can see SLS on Launch Complex 39B (circled), the crawlerway leading south to the Vehicle Assembly Building, and the Atlantic coastline.

Sentinel-2C image of SLS on Launch Complex 39B
Sentinel-2C / MSI · 10 m/pixel · March 30, 2026 · Downloaded from AWS via STAC API (earth-search.aws.element84.com) · Cloud Optimized GeoTIFF
T − 4 hrs
Apr 1
0 km
Fuelled & ready
Remote Sensing

Launch Day Weather Watch

I pulled imagery from three different satellites to watch the weather over Florida. MODIS on Terra sees the Space Coast up close from 705 km. VIIRS on NOAA-20 captures the full peninsula from 824 km. GOES-19 watches from geostationary orbit at 35,786 km, updating every minute. Between them: partly cloudy skies, clearing toward evening. Go for launch.

Weather imagery from MODIS, VIIRS, and GOES-19
Left: MODIS / Terra (705 km) · Centre: VIIRS / NOAA-20 (824 km) · Right: GOES-19 / ABI (35,786 km) · NASA Worldview Snapshots API · April 1, 2026
T + 0 s
6:35 PM
0 → 185 km
Liftoff
Remote Sensing

Ignition

6:35 PM. Twin boosters and four RS-25 engines fire. I processed GOES-19's raw infrared data — the satellite watches from 35,786 km above the equator — and found a sudden heat spike at the exact coordinates of Launch Complex 39B. Each pixel covers roughly 2 km — the rocket's exhaust is diluted across that entire area — yet one pixel lights up clearly above the local background. That bright dot is the rocket.

GOES-19 infrared detection of ignition
GOES-19 / ABI · Band 7, 3.9 μm shortwave IR · Temporal difference vs 1 min before launch · 22:35 UTC · Raw data: s3://noaa-goes19/ABI-L2-MCMIPM/
Remote Sensing

The Trail

I built this animation from seven raw NetCDF files at 30-second intervals, from T−30 seconds through T+150 seconds. Two overlapping mesoscale sectors give this cadence. I subtracted the pre-launch image so only new heat remains. A dot of fire appears, brightens, drifts northeast, then vanishes.

Animated GIF of launch trail
GOES-19 / ABI · 3.9 µm temporal difference · T−30s to T+150s · 30-second cadence · 7 raw NetCDF files from NOAA S3
Remote Sensing

The Plume

I compared the same moment across three different wavelengths. In visible light — it's 6:36 PM, the sun is low — the plume is lost in the clouds. In infrared at 3.9 μm, the exhaust blazes like a lighthouse against the cool ocean. In the fire detection channel — the same algorithm NOAA uses to spot wildfires from space, comparing shortwave IR against the longwave background — the rocket produces a strong, unambiguous signal. Same physics as a wildfire, except this one is accelerating off the pad.

Three wavelengths: visible, infrared, fire detection
GOES-19 / ABI · Left: Band 2 (0.64 μm visible) · Centre: Band 7 (3.9 μm IR) · Right: Band 7 minus Band 14 (fire detection) · T+60s
T + 1 min
6:36 PM
23–52 km
Near-field stations
Seismics

Acoustic-coupled seismic signals at near-field stations

I searched for Raspberry Shake stations near the launch site — citizen-science seismographs built on Raspberry Pis, thousands deployed worldwide, all openly available through FDSN. I found stations at 23 km and 52 km from KSC, pulled their data, and ran it through ObsPy. Both showed strong acoustic-coupled seismic signals arriving within minutes of launch. The signal arrives at roughly the speed of sound (~340 m/s), not at seismic body-wave velocity (6 km/s) — confirming I was seeing atmospheric propagation, not an earthquake. The signal lasted over 2 minutes, matching the 126-second Solid Rocket Booster burn — each second of ascent sending a new wavefront from progressively higher altitude.

Near-field seismic vs acoustic arrivals
Raspberry Shake geophones at 23 km and 52 km from KSC. Cyan shading: expected acoustic window (~340 m/s). Red markers: P-wave (~6 km/s). Blue markers: S-wave (~3.5 km/s). Purple markers: Rg surface wave. Data: Raspberry Shake FDSN (AM network). Bandpass: 0.5–10 Hz. Processed with ObsPy. Analysed by Arushi Nath.
T + 10 min
6:45 PM
0–1,580 km
Acoustic propagation
Infrasound

Infrasound detections across the network

SLS produces over 200 dB of acoustic energy at the pad — I wanted to see how far that signal travelled. I queried the Raspberry Shake/Boom network and the International Monitoring System (IMS, run by the Comprehensive Nuclear-Test-Ban Treaty Organization) for stations within range of KSC. I found 7 Raspberry Boom infrasound sensors within 320 km — and when I plotted their signal-to-noise ratios, the arrival times lined up perfectly with distance, consistent with atmospheric propagation at ~300 m/s.

Sliding-window SNR at 7 Raspberry Boom stations
Sliding-window SNR at 7 Raspberry Boom sensors within 320 km of KSC. Peak times reflect sliding-window centres (5-min windows), not signal onset. Detection band: 0.7–2.0 Hz. Data: Raspberry Shake FDSN. Analysed by Arushi Nath.
Seismics
Infrasound

Listening from Toronto

I built my own infrasound station on my apartment balcony in Toronto: a Raspberry Boom sensor (sensitive below 20 Hz) inside a handmade wind-noise enclosure — a bucket with holes patched with steel wool to reduce wind turbulence while allowing pressure waves through. My Raspberry Boom (R3635) experienced a hardware failure before launch day. My Raspberry Shake seismometer (RC893) recorded continuously but did not detect the launch. Over 1,670 km, the acoustic energy spreads and dissipates through the atmosphere, and any remaining signal coupling into the ground was possibly below the sensor noise floor.

Raspberry Boom sensor with steel-wool-patched bucket
Raspberry Boom + bucket with steel-wool baffles (uncovered)
Deployed on Toronto balcony with CN Tower
Deployed on my balcony · Toronto · CN Tower in background
T + 4 hrs
Apr 2
185 → 76,500 km
Launch night
Astrometry

I located Orion from Chile

This wasn't as simple as pointing a telescope. Precise ephemeris data for Orion only became available once the spacecraft's orbit was established after ICPS separation — before that, there was no reliable public prediction of where to look. Even with coordinates, Orion was racing across the sky at over 500 arcsec/min (~8.5″/sec) and still manoeuvring with uncertain position. I started with T70 — the widest field available (10° × 6.7°) — to maximize my chances of finding it. Four hours after launch, I pointed T70 in Chile and found it. My measured position matched JPL Horizons to within 2 pixels. I captured 6 frames, then switched to T75 — a 250mm telescope with finer resolution (1.72″/px vs 5.81″/px) — for the main photometry run.

T70 · Chile · Wide field (10° × 6.7°)

T70 first acquisition — 8 frames, can you spot Orion?
Can you spot Orion in this? · 8 frames, T70 Chile, Apr 2 02:48-02:53 UTC
T70 first acquisition — Orion marked
Here is Orion moving across the field at 510″/min
First observation of Orion from T70 Chile
First observation · April 2, 02:48 UTC · 1s exposure · 6 frames · Angular velocity 510″/min (Orion at ~35,000 km, ~25 min after TLI burn)
Orion measured vs JPL Horizons predicted position
Position offset from JPL Horizons prediction: 11.9 arcsec (2 pixels)
Orion and ICPS as unresolved blob
T70 · April 2, 02:50 UTC · Orion and ICPS appear as a single blob — not yet resolved at this plate scale

R60 · My observatory · Nerpio, Spain · 0.305m Ritchey-Chrétien

I tried my own telescope first. Orion's orbit was carrying it south — from Dec −14° at launch to −26° by mid-mission. From Spain at 38°N latitude, the spacecraft was low on the southern horizon. My R60 in Nerpio couldn't reach it — below the telescope's pointing limit. The observing window from Europe was narrow and closing fast, so I turned to the iTelescope network in Chile and Australia, where Orion was high in the sky.

R60 slewing to Orion's coordinates — too low on the horizon from this latitude

T75 · Chile · Deep field (2.3° × 1.5°) · 68 frames

Orion spacecraft in telescope crosshairs
Orion in the crosshairs · April 2, 07:01 UTC · SNR 47
T75 · Orion and ICPS tracked across the field · April 2 · Chile
NASA Orion spacecraft

That dot being tracked is this — NASA's Orion spacecraft, carrying four astronauts to the Moon. Image: NASA.

T + 8 hrs
Apr 2
~76,500 km
T75 Chile · 68 frames
Photometry

Measuring Orion's brightness

By hour 8, T75 in Chile had captured 68 frames of Orion and the ICPS separately. I ran photometry on both. Orion held steady around mag 11.5 in V-band — except for one frame where it flared to mag ~10, possibly a specular glint from the solar arrays or a thruster firing. After correcting for changing distance, the fading trend disappeared — confirming it was geometry, not the spacecraft dimming.

Orion raw light curve
Raw light curve. One anomalous bright point at mag ~10.
Orion 1AU corrected
Distance-corrected to 1 AU. Fading trend gone.
~11.5 V
Apparent Mag
68 frames
Two targets
mag 10
Anomalous flare
T + 8 hrs
Apr 2
~76,500 km
ICPS tumbling
Photometry

ICPS rotation period — measured from the light curve

ICPS under construction

The Interim Cryogenic Propulsion Stage — 13.7 m long, 5 m diameter, powered by a single RL-10 engine. After pushing Orion toward the Moon, it separates and tumbles on its own. Image: NASA.

In my data the ICPS faded from mag ~10 to ~12.75 in 30 minutes — its brightness varying as the tumbling cylinder presents different faces to the sun. I built a periodogram and phase-folded the data. The result: a rotation period of 0.376 hours (22.6 minutes), with a clean double-peaked curve consistent with a tumbling cylindrical body.

ICPS raw light curve
Raw light curve. ~2.75-magnitude swing in 30 minutes.
ICPS phased light curve
Phased to 0.376 h. Double-peaked = tumbling cylinder.
Result

ICPS rotation period: 0.376 hours (22.6 minutes). Amplitude: ~2.75 magnitudes.

0.376 h
Rotation Period
~2.75 mag
Amplitude
22.6 min
Full rotation
T + 8 hrs
Apr 2
22,605 km
Debris · line-of-sight
Debris ID

Space debris: a 1989 rocket body crossing the same line of sight

In the same field of view as Orion, a streaking object appeared — not physically close, but passing through the same patch of sky as seen from Earth, 22,605 km away in its own unrelated orbit. I measured its position across 11 1-second CCD exposures over 5 minutes using Tycho 13.3, plate-solved against ATLAS2, and formatted a standards-compliant ADES astrometric report. I submitted it to Project Pluto's satellite identification service.

As crewed missions beyond low Earth orbit become more frequent, documenting and reporting debris encounters like this — even line-of-sight coincidences — contributes to the growing catalogue that keeps future flights safe.

Orion, ICPS, and debris in the same field of view
T75 · April 2, 06:52:52 UTC · Orion–ICPS separation: 12.9 arcmin · Orion–debris separation: 23.0 arcmin
Tracking mode — telescope follows the debris object, stars trail in the background
Match

NORAD 20356 (1989-090C) — a discarded Inertial Upper Stage (IUS) rocket body, orbiting since 1989 in a highly elliptical path (e = 0.64, i = 27.7°, period 410 min). It was 22,605 km from Earth at the time — nowhere near Orion, just crossing the same line of sight. Computed motion: 17.2252″/s heading east — my measured motion: 17.2419″/s in the same direction. A near-exact match.

22,605 km
Debris distance from Earth
37 yrs
In orbit since 1989
11 positions
ADES report
ADES Astrometric Report · Submitted to Project Pluto

11 CCD positions over 5 minutes

V-band magnitudes 10.1–10.6. All positions plate-solved against ATLAS2 with RMS fits 0.33–0.52 arcsec.

Observer: A. Nath · Telescope: 0.25m reflector f/3.8 CCD Software: Tycho 13.3 · Catalogue: ATLAS2 Time (UTC) RA (°) Dec (°) Mag RMS″ 06:52:52 241.4927 −24.7826 10.3 0.46 06:55:15 242.2328 −24.9161 10.5 0.43 06:57:19 242.8721 −25.0271 10.1 0.42 … 11 positions total · full table in arXiv preprint Obs motion: 17.2419″/s PA 101.1° Calc motion: 17.2252″/s PA 101.2°
T + 2 days
Apr 3
~100,000 km
Outbound · TLI complete
Photometry

Second night — 134 more frames from Spain and Chile

T80 in Spain caught Orion for the first time — 10 fast exposures at 0.1 seconds. Then T75 in Chile ran the longest session yet: 124 frames over nearly an hour.

T + 3 days
Apr 4
~100,000 km
Clouded out

Clouds across all three observatory sites. No data. Orion keeps flying — I wait.

T + 4 days
Apr 5
~311,000 km
Outbound coast
Photometry

Halfway to the Moon — still tracking

Orion is coasting toward the Moon at roughly 160,000 km from Earth. It's fainter now — I increased exposures from 1 second to 30 seconds to keep the signal. 60 images over nearly an hour from T75 in Chile.

T75 · Chile · Deep field (2.3° × 1.5°)

Orion at 160,000 km from T75 Chile
April 5, 05:02 UTC · 30s exposure · Angular velocity 11.4″/min — 45× slower than first acquisition · Bright object at bottom is Antares
T75 · Orion drifting through the star field · 30s exposures · 60 frames · Chile
T + 5 days
Apr 6
~320,000 km
Approaching Moon
Astrometry

Twenty hours before the flyby

Orion is deep in cislunar space, closing on the Moon. 20 images from T30, Siding Spring, Australia, at 60-second exposures. Exposure time has doubled again — the spacecraft is now twice as far as last night.

T30 · Australia · Narrow field (42′ × 28′)

Orion approaching the Moon from T30 Australia
April 6, 16:06 UTC · 60s exposure · Angular velocity 11.0″/min — speeding up as the Moon bends its path
T30 · Orion drifting through the star field · 60s exposures · 20 frames · Australia
T + 6 days
Apr 7
~406,000 km
Post-flyby · Record
Astrometry

Two hours after the lunar far-side flyby

The crew has just flown around the far side of the Moon and broken Apollo 13's distance record at 406,771 km. Orion emerged from behind the Moon and I caught it again — 25 images from the same T30 in Siding Spring, Australia.

T30 · Australia · Narrow field (42′ × 28′)

Orion post-flyby, washed out by moonlight
April 7, 15:12 UTC · 60s exposure · Washed out by moonlight — Orion at its farthest, the Moon at its closest
8 nights
Apr 2 · 3 · 5 · 6 · 7 · 8 · 9 · 10
185 → 406k km
Distance tracked
545+ frames
10 telescope sessions
Angular velocity across the mission
Date Distance Velocity Exposure What's happening
Apr 2 02:48 T70 ~35,000 km 510″/min 1s First acquisition — post-TLI, racing
Apr 2 06:37 T75 ~60,000 km 142″/min 1s Climbing to apogee — slowing
Apr 5 ~310,000 km 11.4″/min 30s Coasting — 45× slower than first acq
Apr 6 ~320,000 km 11.0″/min 60s Speeding up — Moon bending the path
Apr 10 ~160,000 km 19.1″/min 10s Inbound — faster than outbound at same distance

On the return (Apr 10), Orion was closer (~167,000 km) and moving faster (1.7 km/s vs 0.9 km/s outbound) — the lunar flyby bent and accelerated its trajectory home.

T + 8 days
Apr 9
~160,000 km
Return coast
Astrometry

Heading home — still tracking from Chile

Orion is on the return leg, falling back toward Earth. 32 images at 60-second exposures from T75 in Chile.

T75 · Chile · Deep field (2.3° × 1.5°)

T75 · Orion tracked on the return coast · 60s exposures · 32 frames · Chile
T + 9 days
Apr 10
~160,000 km
Final observation
Astrometry

The last look — 17 hours before splashdown

The final telescope session of the mission. 150 frames at 10-second exposures over one hour from T75 in Chile — the largest single session, and the last time I would see Orion through a telescope before it re-entered the atmosphere. The Moon was only 28° away, washing the field, but the spacecraft was still there.

T75 · Chile · Deep field (2.3° × 1.5°) · 150 frames

T75 · Orion tracked on its final approach · 10s exposures · 150 frames over 1 hour · April 10, 06:45–07:45 UTC · Chile
T + 9 days
Apr 10
406,771 → 0 km
Splashdown 8:07 PM

Return, re-entry, and splashdown

On April 10 at 8:07 PM EDT, Orion splashed down in the Pacific Ocean ~50 miles off San Diego — the fastest crewed re-entry since Apollo, at Mach 35 and 3,000°F. I monitored re-entry and splashdown with 25+ seismic, infrasound, satellite IR, weather radar, and hydroacoustic sensors across Southern California.

USCG SOLAR chart showing Artemis II splashdown recovery zone
Artemis II recovery zone · U.S. Coast Guard SOLAR chart · Source: USCG Navigation Center (navcen.uscg.gov)
Toolkit

Instruments and software

🔭

Telescopes — all operated remotely from Toronto via iTelescope

T70
T70 · Chile
Samyang 135mm f/3.5 · FOV 9.97° × 6.66° · 5.81″/px
T75
T75 · Chile
250mm f/3.8 · FOV 2.29° × 1.53° · 1.72″/px
T80
T80 · Spain
65mm f/2.8 · FOV 10.37° × 6.93° · 5.81″/px
T30
T30 · Australia
508mm f/4.4 · FOV 41.6′ × 27.8′ · 0.81″/px
R60 · Spain (mine)
0.305m RC · Nerpio · Too low for Orion
📡 Raspberry Shake + Boom (AM network), IMS/CTBTO, DWPF broadband, CI + AZ seismic (SCEDC) · 30+ stations
🛰 Sentinel-2C (ESA), GOES-19 + GOES-18 (NOAA), MODIS (NASA), VIIRS/NOAA-20, GLM lightning mapper
📡 NEXRAD KNKX/KSOX/KVTX weather radar, MBARI MARS hydrophone, GNSS TEC
💻 AstroPy, Photutils, ObsPy, Astrometry.net, Tycho 13.3, netCDF4, GDAL, Project Pluto
📊 Periodograms, differential photometry, ADES reports, STA/LTA triggers, envelope z-scores
📝 arXiv preprint forthcoming · Full data + code to be released · CC-BY-4.0